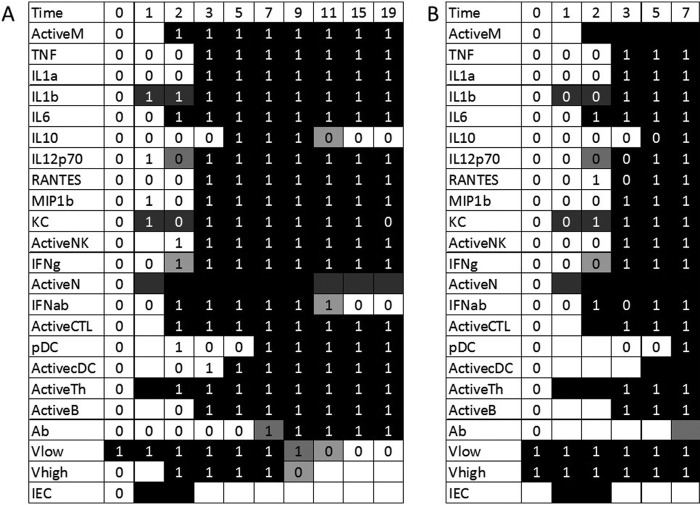
FIG 2.
Optimal fits to the full data set for older mice in sublethal (A) and lethal (B) simulations. Experimental data are indicated with 0's and 1's. Variables for which no data were measured are indicated with a blank cell. The simulated trajectories are indicated by the shading of the table cell, where a black cell represents a variable predicted to have a value of 1 at that time point and a white cell represents a variable predicted to have a value of 0. Thus, if a black cell overlaps a value of 1, the simulation correctly predicts that variable's trajectory at that point. A white cell overlapping a value of 0 is also a correct prediction. Blank cells can predict a value of either 0 or 1 without penalty. A total of 18 data points are missed in the optimal fit.

