FIG 10.
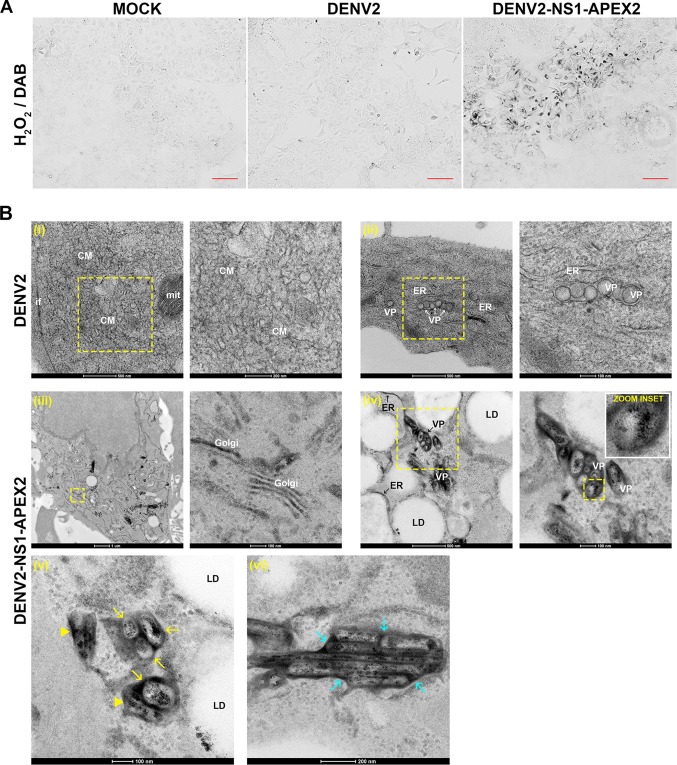
APEX electron microscopy analysis of NS1 localization. Huh-7.5 cells were mock infected or infected with untagged DENV2 or DENV2-NS1-APEX2 (MOI of ∼0.01) and cultured for 96 h prior to fixation and labeling with DAB-H2O2. (A) Light microscopy revealed the presence of DAB polymerization only in DENV2-NS1-APEX2-infected cells (right panel). Scale bars, 100 μm. (B) Samples were then processed for EM. Compared to mock-infected cells (not shown), DENV2-infected cells (upper panels) displayed characteristic virus-induced ER rearrangements including CMs (see subpanel i) and VPs (see subpanel ii). Scale bars are 500, 200, 500, and 100 nm, left to right, as indicated. In contrast, DENV2-NS1-APEX2-infected cells revealed discernible DAB deposition in the Golgi apparatus (subpanel iii), ER membranes (see “ER” arrowheads in subpanel iv), and intense diffuse staining of VP membranes and punctate staining of the VP interior (see “zoom inset”). Scale bars are 1,000, 100, 500, and 100 nm, left to right, as indicated. Enlarged views are shown to the right of each boxed area. In addition to localization to the surface and interior of VPs (see yellow arrows in subpanel v), NS1-APEX2 was also detected in irregular punctae that were adjacent to VPs (see yellow arrowheads in subpanel v). Furthermore, NS1-APEX2 was less frequently identified in regular arrays (see cyan arrowheads in subpanel vi) that featured more diffuse membrane staining and punctate luminal staining. The scale bars for subpanels v and vi are 100 and 200 nm, respectively. CM, convoluted membranes; mit, mitochondrium; VP, vesicle packet; ER, endoplasmic reticulum; LD, lipid droplet.

