FIG 12.
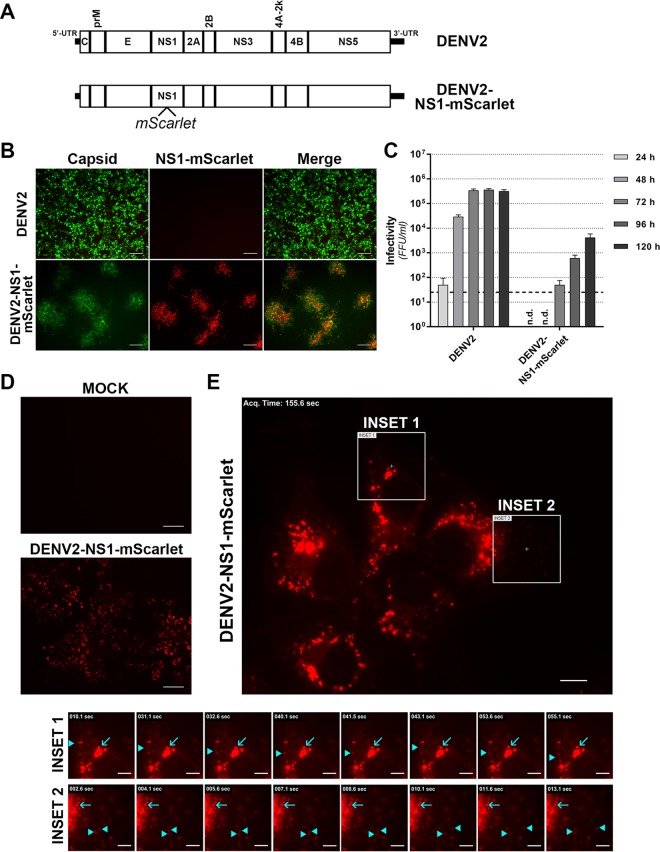
Live cell imaging of mScarlet-tagged NS1 in infected cells. (A) Schematic diagram of the DENV2-NS1-mScarlet construct. (B and C) Infectivity of DENV2-NS1-mScarlet compared to wild-type DENV-2. Huh-7.5 cells were transfected with wild-type DENV-2 or DENV2-NS1-mScarlet RNA transcripts, and cell culture supernatants were collected at 24 to 120 h posttransfection for determination of virus infectivity by focus-forming assay (FFA). (B) The immunofluorescent micrographs show representative images from a FFA of cells infected with undiluted DENV-2 or DENV2-NS1-mScarlet supernatants collected at 120 h posttransfection. Cells were labeled with anti-E antibody (green) and mScarlet-associated epifluorescence was also visualized (red). Scale bars, 100 μm. (C) Quantitation of infectivity by FFA. Data are means + the SD (n = 3). The dashed line indicates the limit of detection. n.d., not detectable. (D and E) Live cell imaging of Huh-7.5 cells transfected with DENV2-NS1-mScarlet transcripts (6 days posttransfection). (D) Detection of mScarlet autofluorescence in live Huh-7.5 cells after mock transfection (“Mock”) or transfection DENV2-NS1-mScarlet RNA transcripts. Scale bars, 100 μm. (E) Live cell imaging of NS1-mScarlet localization and traffic. Insets depict examples of intensely fluorescent, relatively static NS1-mScarlet foci (cyan arrows) and weakly fluorescent, highly motile NS1-mScarlet foci (cyan arrowheads). See also Movie S1 in the supplemental material. Scale bars are 10 μm for the main image and 5 μm for the insets.

