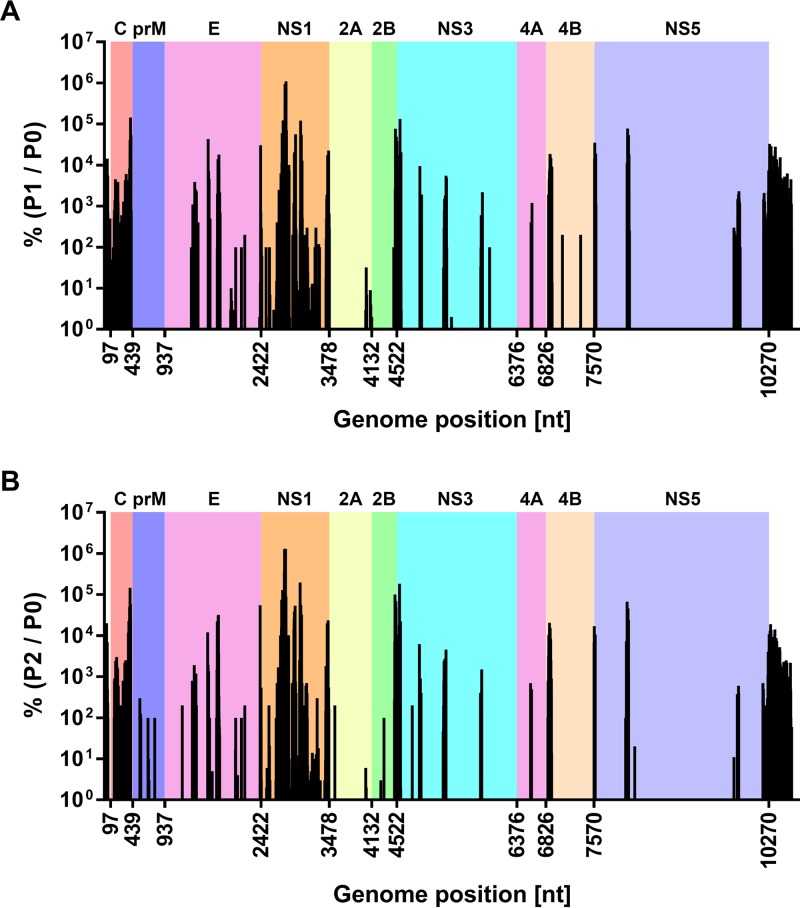
FIG 2.
Tolerance of transposon insertions in DENV-2 expressed as a percentage of the initial input mutant RNA pool. (A) Graph depicting the frequency of insertions in the replication-competent pool (pool 1; P1), expressed as a percentage of the frequency of the corresponding mutants in the initial mutant RNA pool (pool 0; P0). (B) Similarly, the frequency of insertions in the infectious pool (pool 2; P2) was expressed as a percentage of the frequency of the corresponding mutants in the initial mutant RNA pool (pool 0; P0). Nucleotide positions along the x axis indicate the junctions of the coding sequences of the individual DENV-2 proteins. For clarity, the regions encoding the respective DENV-2 proteins are indicated as colored backgrounds. Note that one insertion count was added to the raw counts for pool 0 to enable representation of insertions that only appeared in pools 1 and/or 2, but not in pool 0. See also Data Set S1 in the supplemental material.

