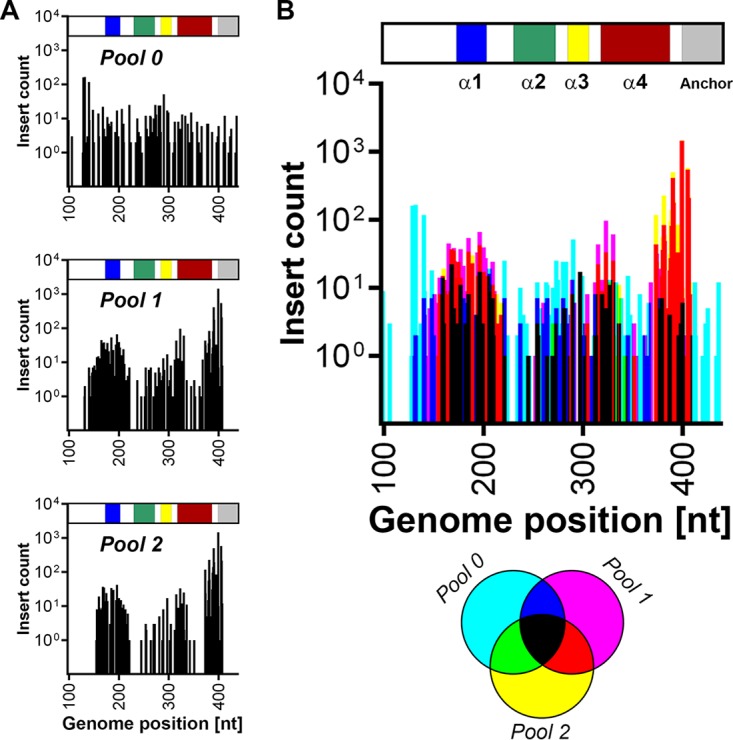
FIG 4.

Tolerance of transposon insertions within the capsid-encoding sequence. (A) The insertional mutagenesis profile within the capsid-encoding region of the DENV-2 genome was examined with respect to capsid protein domains. In the capsid schematic the α1, α2, α3, and α4 alpha helices are colored blue, green, yellow, and red, respectively, while the transmembrane anchor is colored gray. The graph in the upper panel shows the distribution of insertions in the input mutant RNA pool (pool 0). The graph in the middle panel shows the number of raw sequencing reads for each insertion in the replication competent pool (pool 1), while the graph in the lower panel shows the number of reads for each insertion in the infectious virus pool (pool 2). (B) Graphical overlay of the number of raw reads for each transposon insertion site in pool 0 (cyan), pool 1 (magenta), and pool 2 (yellow) and where they overlap, according to the legend below the graph. The x axis shows the DENV-2 nucleotide positions of the capsid-encoding region (nt 97 to 342).
