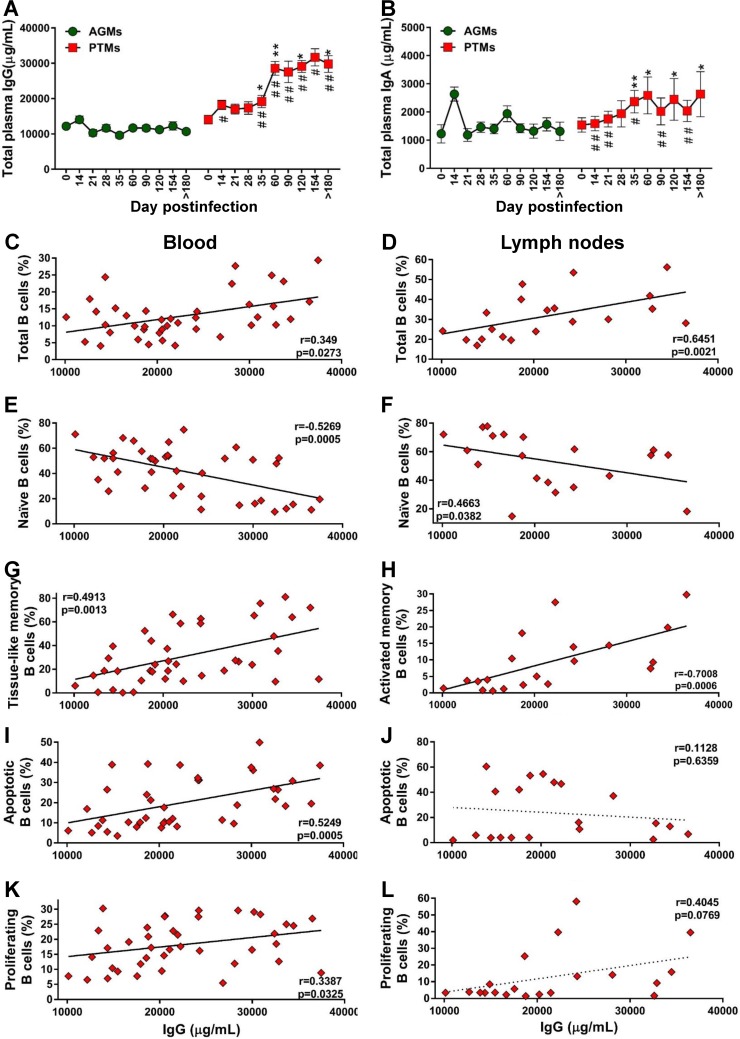
FIG 10.
Assessment of the relationship between B cell dysfunction and overall humoral immune response over the course of progressive SIVsab infection of AGMs and nonprogressive SIVsab infection of PTMs. (A and B) Total levels of IgG (A) and total IgA (B) in AGMs and PTMs. Dotted lines mark the baseline levels of the different cell subsets. The Mann-Whitney U test was used to assess significance. Error bars correspond to standard errors of the means. Significant changes from the preinfection baseline levels are indicated as follows: *, P < 0.05; **, P < 0.01; and ***, P < 0.001. Significant differences between pathogenic and nonpathogenic species at same time point are indicated as follows: #, P < 0.05; ##, P < 0.01; and ###, P < 0.001. Significant positive correlations were established during the pathogenic SIV infection of PTMs between the levels of total IgG and total (C) and tissue-like memory (G) B cells from circulation (C) and total (D) and activated (H) B cells from the lymph nodes (D). Negative correlations between were established during the pathogenic SIV infection of PTMs between the levels of total IgG and the naive B cells from the peripheral blood (E) and lymph nodes (F). Significant positive correlation between the levels of total IgG and the levels of apoptotic B cells (I) and proliferating B cells (K) from peripheral blood and only trends for a negative correlation with the levels of apoptotic B cells (J) and for a positive correlation with the levels of proliferating B cells (L) from the lymph nodes were established. Relationships between the levels of total B cells and subsets, apoptotic and proliferating B cells from blood and lymph nodes, and total IgG were assessed using the Spearman rank correlation test. Significant correlations and positive or negative trends are illustrated by solid and dotted lines, respectively; P and Spearman rank correlation (r) value are shown.

