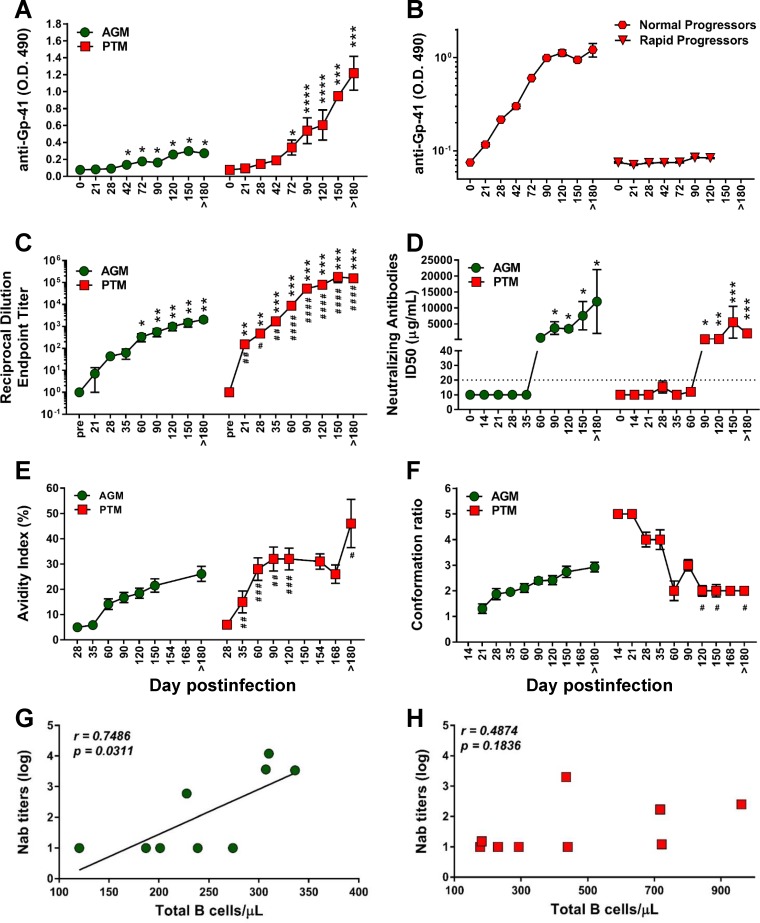
FIG 11.
Antibody responses and antibody maturation profiles over the course of progressive SIVsab infection of AGMs and nonprogressive SIVsab infection of PTMs. (A) Anti-gp41 titers in AGMs and PTMs; (B) anti-gp41 antibody titers in normal progressor versus rapid progressor PTMs; (C) mean of endpoint titers of the highest reciprocal dilution; (D) neutralization antibodies titers; (E) mean avidity index; (F) mean conformation ratio. The Mann-Whitney U test was used to determine significance. Error bars correspond to standard errors of means. Significant differences compared to baseline values before infection are indicated as follows: *, P < 0.05; **, P < 0.01; ***, P < 0.001; and ****, P < 0.0001. Significant differences between AGMs and PTMs for the same time point are indicated as follows: #, P < 0.05; ##, P < 0.01; ###, P < 0.001; and ####, P < 0.0001. (G) Significant positive correlation between total peripheral B cells and production of neutralizing antibodies in AGMs (green circles). (H) Lack of correlation between the levels of total B cells and production of neutralizing antibodies in PTMs (red squares). Relationships between the levels of neutralizing antibodies and absolute counts of the total B cells were assessed using the Spearman rank correlation test. Significant correlations are represented by solid line; P and Spearman rank correlation (r) values are shown.

