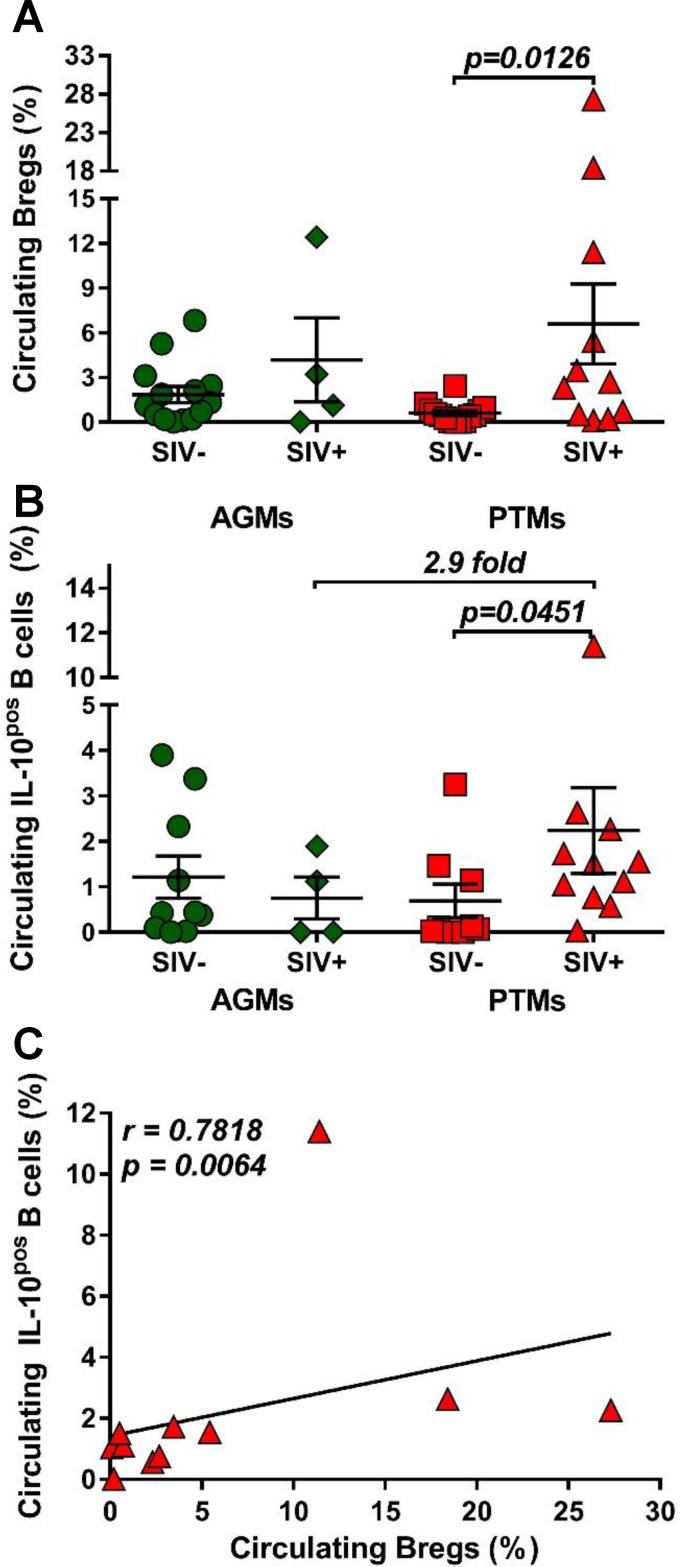
FIG 4.
Frequencies of regulatory B cells and IL-10 production over the course of progressive SIVsab infection of AGMs and nonprogressive SIVsab infection of PTMs. (A) Frequencies of regulatory B cells in uninfected (green circles) versus SIVsab-infected (green diamonds) AGMs and uninfected (red squares) versus SIVsab-infected (red triangles) PTMs. (B) Expression of IL-10 in circulating total B cells from uninfected versus SIVsab-infected AGMs and uninfected versus SIVsab-infected PTMs. (C) Positive correlation between circulating total B cells expressing IL-10 and circulating Bregs in PTMs infected with SIVsab. Values of individual animals are plotted, with the group means (long solid lines) and standard errors of the means (short solid lines) shown. The Mann-Whitney U test was used to assess significance; P values are shown. Relationships between total circulating B cells expressing IL-10 and of the frequency of total circulating Bregs were evaluated using the Spearman rank correlation test. The significant correlation illustrated as a solid line; P and Spearman rank correlation (r) values are shown.

