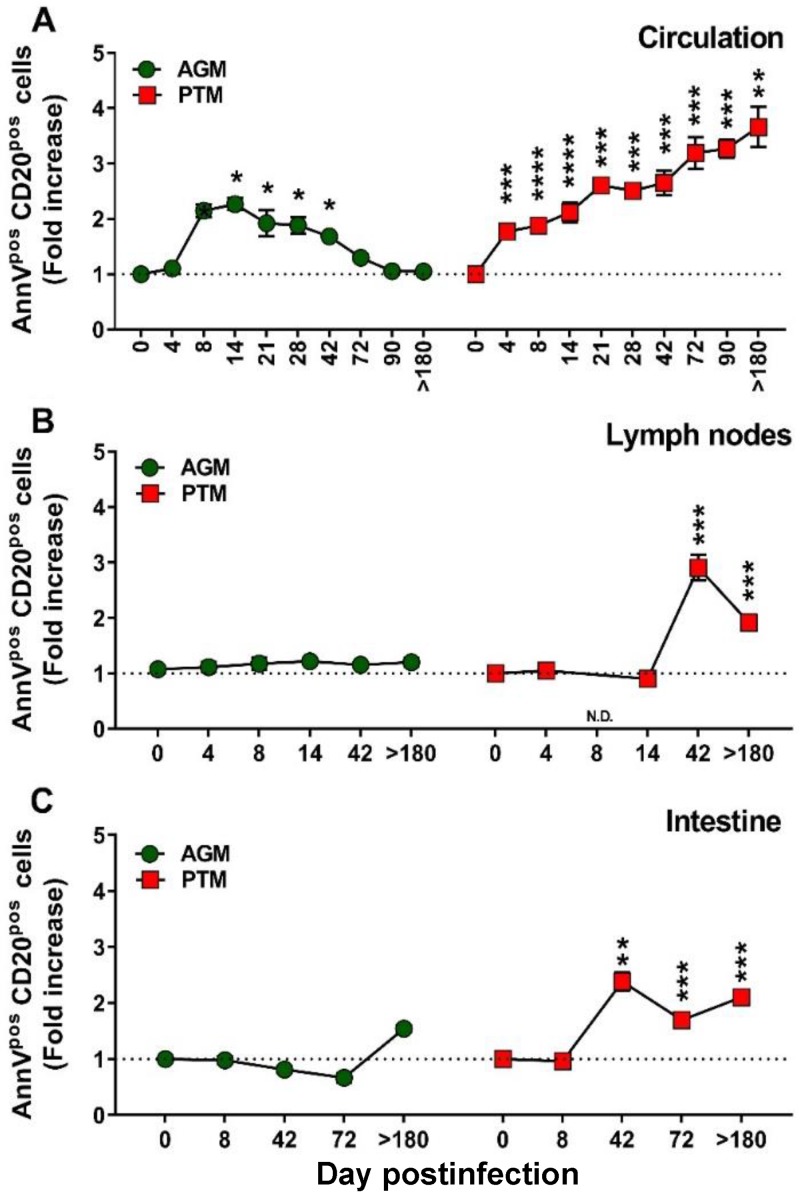
FIG 6.
Changes in the levels of apoptotic B cells over the course of progressive SIVsab infection of AGMs and nonprogressive SIVsab infection of PTMs. Fold increases of the apoptotic cells from the PBMCs (A), lymph nodes (B), and intestine (C) are shown. AGMs are shown by green circles and PTMs by red squares. Dotted lines mark the baseline levels of the different cell subsets. The Mann-Whitney U test was used to assess significance. Error bars correspond to standard errors of the means. Significant changes from the preinfection baseline levels are indicated as follows: *, P < 0.05; **, P < 0.01; and ***, P < 0.001. AnnV, annexin V.

