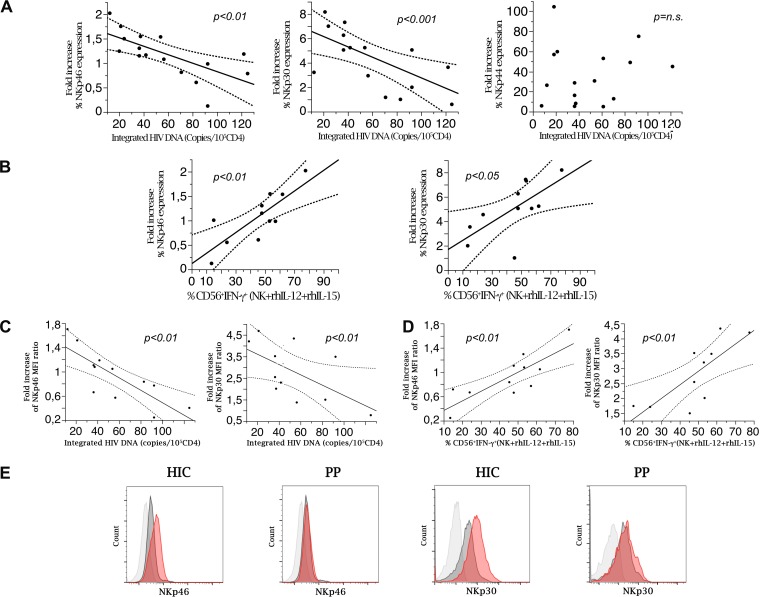
FIG 4.
Induced NCR expression by NK cells is inversely associated with the HIV DNA reservoir and correlates with IFN-γ production. (A) Integrated HIV DNA copy numbers are inversely correlated with the fold increase in NKp46 or NKp30 expression on purified NK cells after in vitro activation with rhIL-2 in HIV controller patients. (B) Peripheral NK cell IFN-γ production is directly correlated with the fold increase in NCR (NKp46 and NKp30) expression on purified activated NK cells in HIV controller patients. The graphs show correlation analysis of NK cells producing IFN-γ in response to cytokine stimulation (rhIL12+rh-IL-15) and fold increases of NKp46 and NKp30 expression on purified NK cells after in vitro activation with rh-IL-2 (n = 12). (C) The HIV DNA reservoir in HIC (n = 12) is inversely correlated with fold increase of NCR molecule density, expressed as MFI, on purified NK cells after in vitro activation with rh-IL-2. Molecule densities are expressed as ratios of sample MFI to control MFI to account for intersample variability (P < 0.01). (D) Peripheral NK cell IFN-γ production in response to cytokine stimulation (rhIL-12/rhIL-15) is directly correlated with fold increases of NKp46 and NKp30 molecule density, expressed as MFI, on purified NK cells after in vitro activation with rhIL-2 (P < 0.01). Data are representative for 12 different patients. (E) Representative shifts in NKp46 and in NKp30 molecule expression and density after stimulation with rIL-2 in vitro for highly purified NK cells in former progressor patients after 24 month of successful cART (PP) and in HIV controller patients (HIC). The graphs show the results of flow cytometric analysis and overlay histogram representations. Light gray histogram, negative control; dark gray histogram, resting cell NCR (NKp46 and NKp30) expression; red histogram, NCR expression after 48 h of culture in the presence of rIL-2 200 IU/ml.

