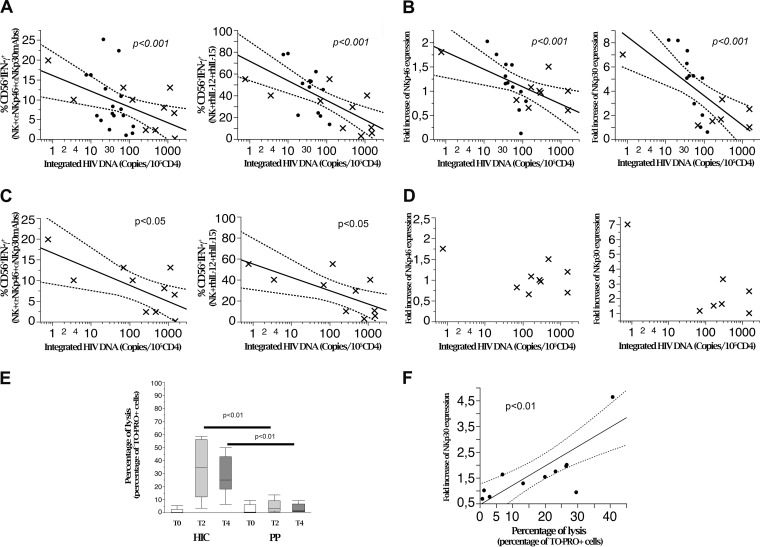
FIG 5.
NK cell function inversely correlates with HIV DNA reservoir size across widely divergent disease courses. (A) Linear correlation analysis of integrated HIV DNA with IFN-γ production by NK cells triggered by activating receptors (NKp46 and NKp30) (n = 27) or by cytokines (rhIL-12 plus rhIL-15) (n = 27) in HIC (dots) and PP. (B) Correlation analysis of integrated HIV DNA and fold increases of NCR (NKp46 [n = 21] and NKp30 [n = 19]) expression on purified NK cells after in vitro activation with rhIL-2 in HIC (dots) and PP (x). Data are representative of 21 experiments. (C) Correlation analysis for PP alone (x) of integrated HIV DNA and IFN-γ production by NK cells triggered by activating receptors (NKp46 and NKp30) (n = 10) or by cytokines (rhIL-12 plus rhIL-15) (n = 10). (D) Correlation analysis for PP alone (x) of integrated HIV DNA and fold increases of NCR (NKp46 [n = 9] and NKp30 [n = 7]) expression on purified NK cells after in vitro activation with rh-IL-2 (n.s., not significant). (E) Purified NK cell cyototoxicity before and after 2 and 4 days of in vitro activation in the presence of rhIL-2 (200 U/ml). A PKH-26/TO-PRO3 flow cytometric cytotoxicity assay was performed. Box plots indicate the percentages of target cell lysis in the presence of NKp30-specific MAbs in HIC (n = 14) and PP (n = 7). In the box plots, bars represent range, lines represent median values, and box tops and bottoms represent 75th and 25th percentiles, respectively (P < 0.01 by the Mann–Whitney U test). (F) Correlation analysis of NK cell cytotoxicity and NKp30 induction upon in vitro rhIL-2 activation in HIC (n = 6) and PP (n = 5). HIC, HIV-controller patients; PP, progressor patients who were aviremic and needed cART to control viral replication.

