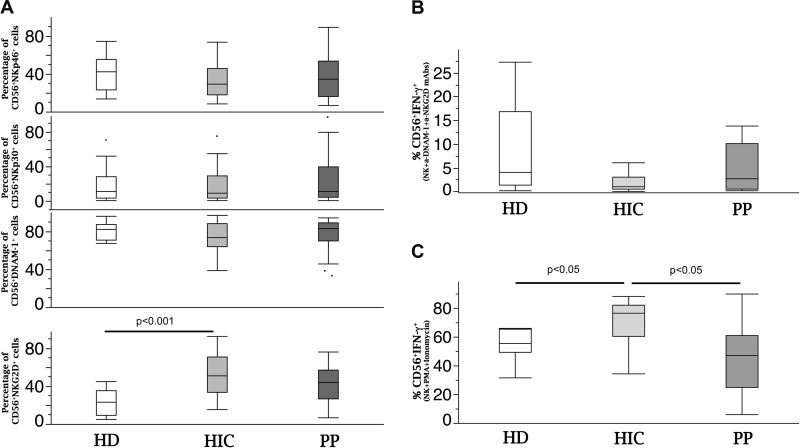
FIG 6.
Baseline expression of activating receptors on NK cells and IFN-γ-producing potential under NKG2D and DNAM-1 triggering and under maximal stimulation. (A) Flow cytometric analysis of peripheral NK cells in HD (white), HIC (light gray), and PP (dark gray). (B and C) IFN-γ production by NK cells upon NKG2D- and DNAM-1 triggering (B) or via PMA and ionomycin (C). For box plot analysis, bars represent ranges, lines represent median values, and box tops and bottoms represent 75th and 25th percentiles, respectively (P < 0.05 or P < 0.001 by the Mann–Whitney U test). HD, healthy donors (n = 10); HIC, HIV controller patients (n = 20); PP, progressor patients (n = 10).

