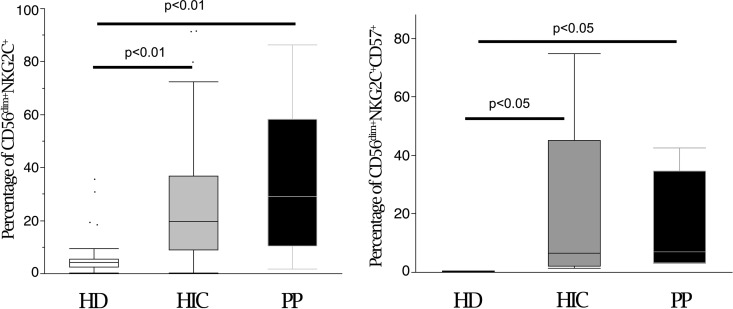
FIG 8.
NK cells from HIC and PP show similar proportions of memory-like NK cells. CD3− CD14− CD19− cells were gated by flow cytometric analysis and analyzed for CD56 and NKG2C/CD57 expression in HD (white), HIC (gray), and PP (black). In the box plots, bars represent ranges, lines represent median values, and box tops and bottoms represent 75th and 25th percentiles, respectively (P < 0.05 or P < 0.01 by the Mann-Whitney U test). Data are representative of 30 experiments. HD, healthy donors (n = 10); HIC, HIV controller patients (n = 10); PP, progressor patients (n = 10).

