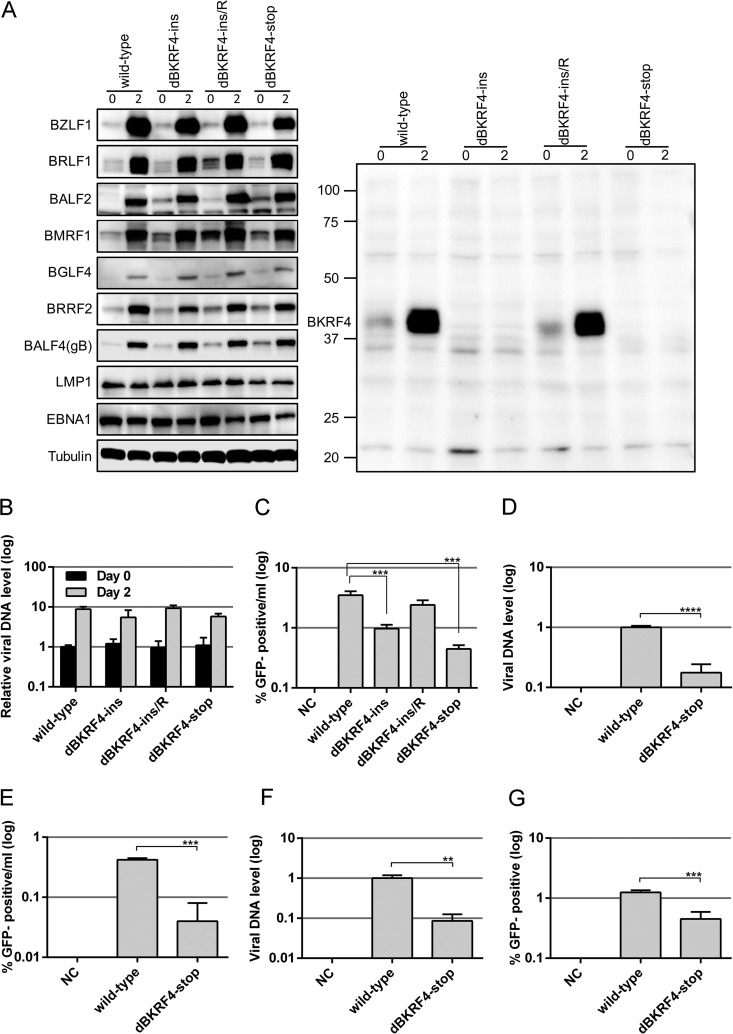
FIG 3.
Viral protein expression, DNA replication, and progeny production of BKRF4-knockout EBV in HEK293 cells. (A) HEK293 cell clones that latently maintained the recombinant B95-8 EBV-BAC genome constructed above were transfected with the BZLF1 expression vector by electroporation. Cells were harvested after 0 and 2 days and subjected to IB with anti-BZLF1, anti-BRLF1, anti-BALF2, anti-BMRF1, anti-BGLF4, anti-BRRF2, anti-BALF4(gB), anti-LMP1, anti-EBNA1, anti-tubulin, and anti-BKRF4 antibodies. (B) Cells transfected as in panel A were harvested after 0 and 2 days and subjected to qPCR to detect levels of EBV DNA and genomic DNA of host cells. The means ± the SD of three independent biological replicates are shown after normalization to the value of host control. (C) Cells transfected as in panel A were cultured for 3 days, and the virus particles were collected from both the cells and media. After freezing/thawing and centrifugation, supernatants containing virus particles were used to infect Akata(−) cells. The percentage of GFP-positive cells was determined by FACS and is shown in log scale. The means ± the SD of three independent biological replicates are shown. A Student t test was performed. ***, P < 0.005. (D) Cells lytically induced as in panel A were cultured for 3 days, and virion particles were collected from culture media and treated with Turbo DNase I. After DNA extraction, EBV genomic DNA was quantified by qPCR, and the results are shown in log scale. (E) Using the same sample, Akata(−) cells were infected, and the percentage of GFP-positive cells was determined by FACS. (F) Virus stock solutions prepared as in panel D were attached to Akata(−) cells at room temperature with rotation for 3 h. EBV virion DNA levels bound to the cells were determined by qPCR. (G) Akata(−) cells were infected with the same virus stock solution after normalization to the data in panel F, and the percentage of GFP-positive cells was determined by FACS. The means ± the SD of three independent biological replicates are shown. Student t test was performed. **, P < 0.01; ***, P < 0.005; ****, P < 0.0001.

