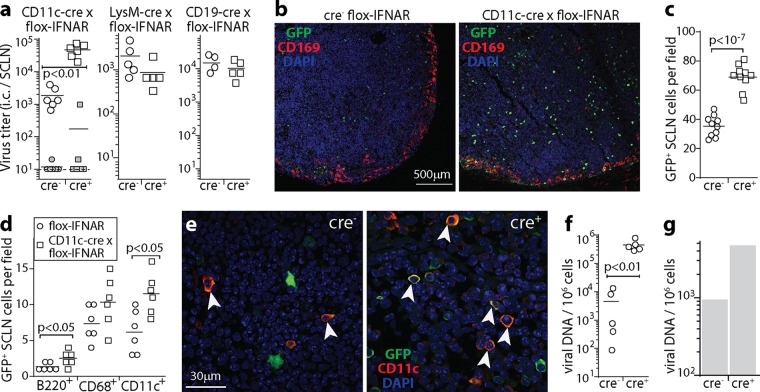
FIG 6.
Tracking lymphoid infection in CD11c-cre × flox-IFNAR mice. (a) CD11c-cre × flox-IFNAR, lysM-cre × flox-IFNAR, CD19-cre × flox-IFNAR, and cre− littermate control mice were given MHV-GFP i.n. (105 PFU in 5 μl). At day 9, infectious-center (i.c.) assays recovered significantly more virus from SCLN of CD11c-cre × flox-IFNAR mice than from controls (open symbols). The closed symbols show plaque titers of preformed infectious virus (freeze-thawed samples), for which CD11c-cre × flox-IFNAR mice did not differ significantly from controls, nor did the i.c. titers in LysM-cre × flox-IFNAR and CD19-cre × flox-IFNAR mice differ from those in controls. Symbols show data for SCLN of individual mice, and bars show group means. Data in the 3 graphs are from experiments done at different times, so comparisons can be made between cre+ and cre− groups within each graph but not between graphs. (b) Mice were infected as described above for panel a. At day 9, SCLN sections were stained for viral GFP plus CD169 to identify SSM. Nuclei were stained with DAPI. (c) Total GFP+ cell counts for SCLN sections from infected CD11c-cre × flox-IFNAR and cre− controls, as described above for panel b, for 10 sections from 3 mice per group, counting at least 5 fields of view per section. Symbols show mean counts for each section, and bars show group means. (d) At day 9, SCLN sections from mice, as described above for panel b, were stained for viral GFP and for B220 (B cells), CD68 (myeloid cells), CD169 (SSM), or CD11c (DC) to identify types of infected cells. Staining was quantitated for 6 sections from 3 mice per group, counting at least 5 fields of view per section. Symbols show mean counts for each section. Bars show group means. Significant differences between groups are shown. Few CD169+ cells were GFP+, so these cells were not counted. (e) Example CD11c staining quantitated as described above for panel d. Colocalization appears in yellow. Arrows show example CD11c +GFP+ cells. (f) CD11c-cre × flox-IFNAR mice and cre− littermate controls were infected as described above for panel a. At day 17, spleens were analyzed for infection by quantitative PCR of viral genomes, normalized by the number cellular genome copies in each sample. Circles show data for individual mice. Bars show means. (g) Mice were infected as described above for panel a, day 17 spleens were pooled from 3 mice per group, and B220hi B cells were purified by flow cytometric sorting. Viral loads were then measured by quantitative PCR as described above for panel f. B cell colonization was greater in CD11c-cre × flox-IFNAR mice than in cre− controls, so when CD11c+ cells lacked IFNAR signaling, more infection passed to B cells.

