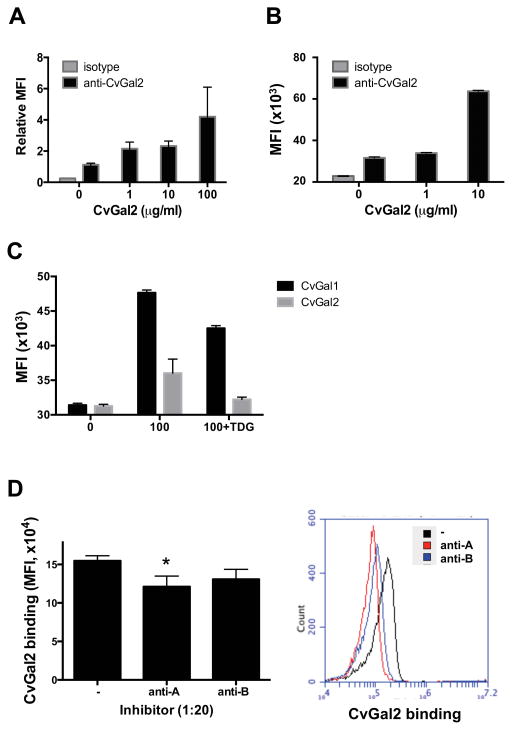
Figure 10. Recombinant CvGal2 binds to oyster hemocytes.
(A) Attached hemocytes were incubated with different concentration of rCvGal2 for 1h at RT. The binding of rCvGal2 to attached hemocytes were detected and revealed under fluorescent microscope as described in Materials and Methods. The fluorescent intensity from at least 5 randomly selected views was quantified and normalized to the ones without exogenous rCvGal2 (0). Data are shown as relative mean fluorescent intensity (MFI)±SD. (B) Freshly isolated hemocytes were fixed as unattached and incubated with different concentration of rCvGal2 (0–10 μg/ml) for 1h at RT. The cells were stained with anti-CvGal2 antibody followed by FITC-conjugated secondary antibody; and the binding of recombinant proteins was revealed by flow cytometry. Data show as MFI±95%CI. (C) Fixed hemocytes were incubated with CvGal1 or CvGal2 (100 μg/ml) with or without thiodigalactose (TDG) for binding assay by flow cytometry as above. (D) Fixed cells were pre-incubated with anti-A or anti-B antibodies to outcompete rCvGal2 binding before adding rCvGal2 (2 μg/ml) for binding assay by flow cytometry as above. Data are shown as MFI±95%CI, *: p<0.05; ***: p<0.001 vs. control (−).

