
Fig. 6.
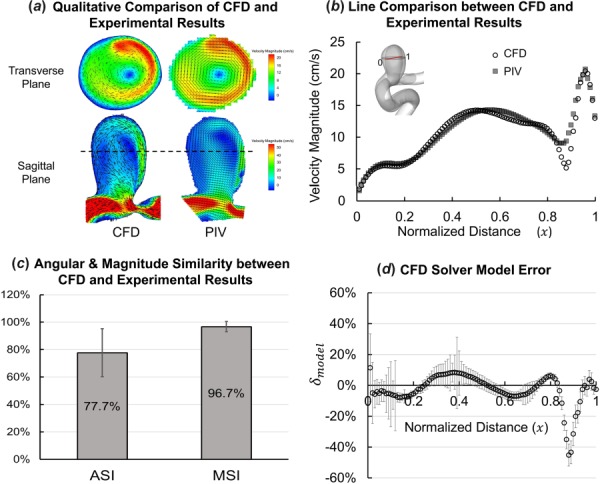
Results of application of different validation approaches to the CFD results and experimental measurements. (a)–(c) Previous validation techniques and (d) proposed validation methodology. (a) Qualitative comparison showing velocity magnitude contours with in-plane velocity vectors of constant length plotted on top (in black) to illustrate the flowdirection in the sagittal plane in CFD and PIV. (b) Pointwise velocity magnitudes from star-ccm+ simulation (CFD, hollow circles) and experimental measurement (PIV, shaded squares) plotted along the validation line normalized from 0 to 1. (c) Average ASI and MSI calculated over the validation line. (d) Pointwise mode error () plotted along the validation line showing the error and uncertainty in star-ccm+ simulation results.