Fig. 1.

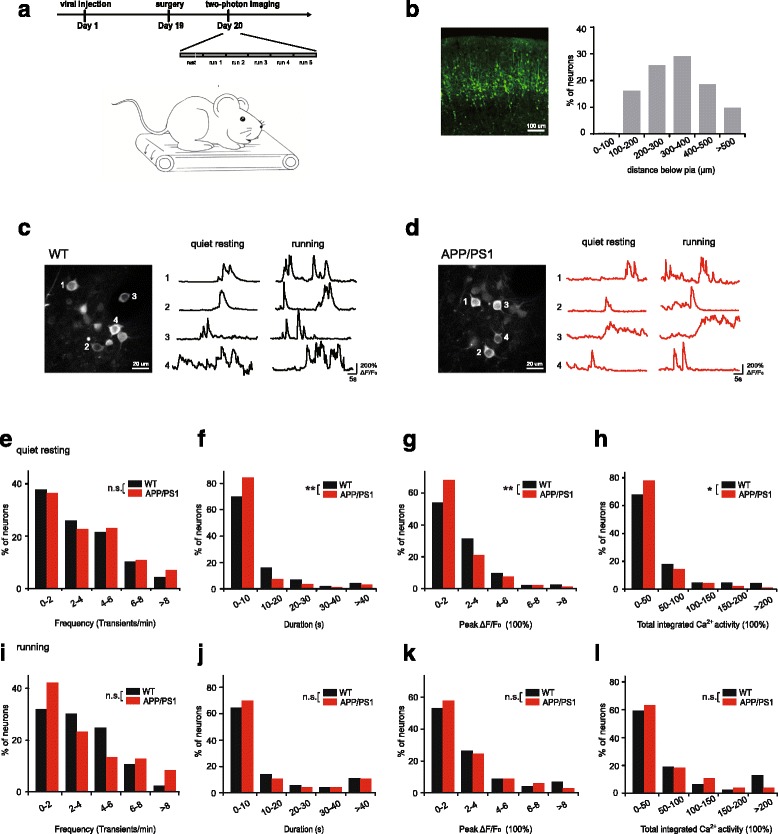
Somatic calcium activities of APP/PS1 mice are lower than WT mice during quiet resting, but not during treadmill running. a. Experimental design. After viral infection and surgery, layer 2/3 neurons of the motor cortex were imaged over 1 min under quite resting and over 5 treadmill running trials (60 s each trial). b. The confocal image of neurons labeled by AAV-syn-GCaMP6s in the mouse primary motor cortex (left); Distance distribution of GCaMP6s-expressing somas shows most of the labeled cells are in layer 2/3 (right). c. A representative image of somatic calcium activity in WT mice (left). Fluorescence traces of 4 different somas during quiet resting and running states (right). d. A representative image of somatic calcium activity in APP/PS1 mice (left). Fluorescence traces of 4 different somas during quiet resting and running states (right). e-h. Distributions of the frequency (e), duration (f), peak ΔF/F0 (g) and total integrated activity (h) of somatic calcium transients in WT and APP/PS1 during quiet resting (WT: 4 mice, 185 somas; APP/PS1: 5 mice, 186 somas. Mann-Whitney U Test). i-l. Distributions of the frequency (i), duration (j), peak ΔF/F0 (k) and total integrated activity (l) of somatic calcium transients in WT and APP/PS1 during treadmill running (WT: 4 mice, 169 somas; APP/PS1: 5 mice, 180 somas. Mann-Whitney U Test). *P < 0.05, **P < 0.01, ***P < 0.001. n.s., not significant
