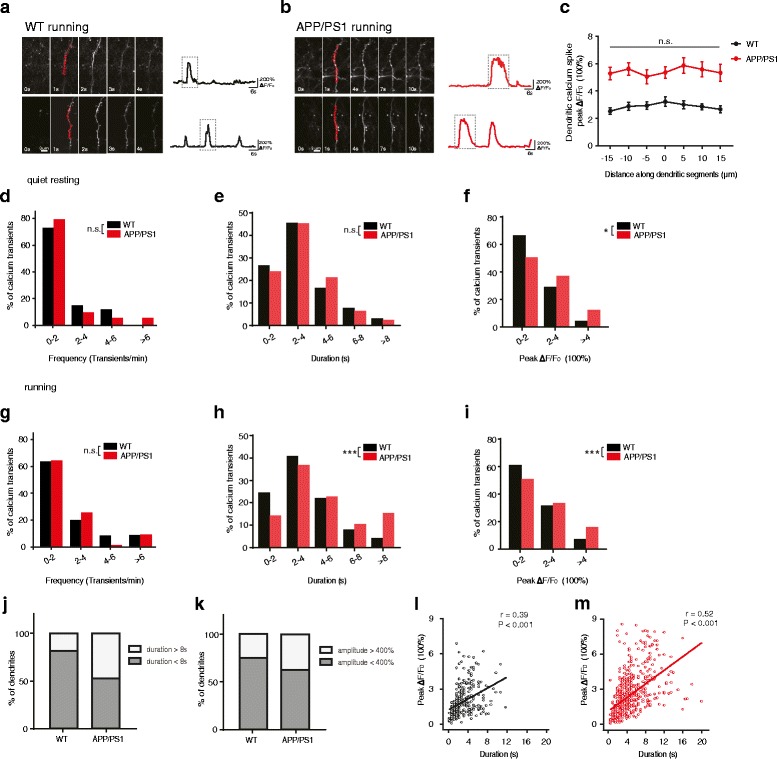
Fig. 3.

The duration and peak ΔF/F0 of dendritic calcium transients are higher in APP/PS1 mice than in WT mice during running. a-b. Time-lapse images of dendritic calcium transients in WT (a) and APP/PS1 mice (b) during running. Apical dendrites of layer 2/3 pyramidal neurons exhibiting large calcium transients at time point 1 s were shown in red. Their calcium fluorescence traces were shown on the right. c. Measurements of calcium fluorescence along long dendritic segments in the plane of imaging. Comparable fluorescent signals were observed across dendritic segments in both WT (n = 10) and APP/PS1 mice (n = 10). d-f. Distributions of the frequency (d), duration (e) and peak ΔF/F0 (f) of dendritic calcium transients in WT and APP/PS1 mice under quiet resting state (WT:4 mice, 90 dendritic calcium transients; APP/PS1: 5 mice, 121 dendritic calcium transients. Mann-Whitney U Test). g-i. Distributions of the frequency (g), duration (h) and peak ΔF/F0 (i) of dendritic calcium transients in WT and APP/PS1 mice during treadmill running (WT: 4 mice, 297 dendritic calcium transients; APP/PS1: 5 mice, 543 dendritic calcium transients. Mann-Whitney U Test). j. The percentage of dendrites with at least one prolonged dendritic calcium transient (duration >8 s) during running in WT and APP/PS1 mice. k. The percentage of dendrites with at least one dendritic calcium transient with large peak amplitude (amplitude >400%) during running in WT and APP/PS1 mice. l-m. The duration of individual dendritic calcium transients correlates with the peak amplitude of calcium transients in both WT (l) and APP/PS1 mice (m) during running (WT: 4 mice, 297 dendritic calcium transients; APP/PS1: 5 mice, 543 dendritic calcium transients). Data in c are represented as the mean ± s.e.m. *P < 0.05, **P < 0.01, ***P < 0.001. n.s., not significant
