
Fig. 7.
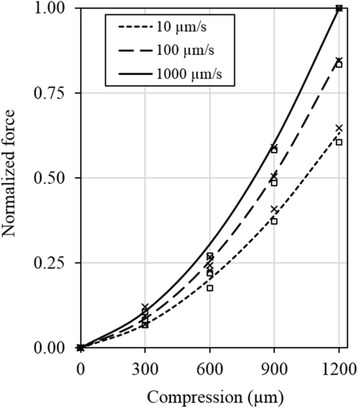
Normalized reaction force at three compression rates for the normal intact joints. The lines show the average results taken from Fig. 2a, while the symbols show the results for individual joints (□: Figs. 3a; ×: 4a). The value shown was normalized by the reaction force at 1200-μm compression applied at 1000 μm/s in each case