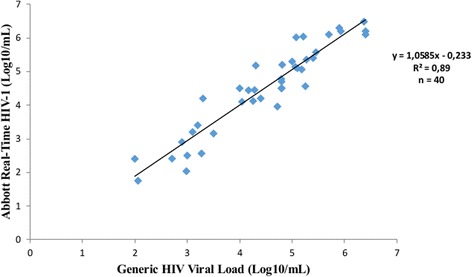
Fig. 1.

Correlation between Generic HIV viral load and Abbott Real-Time HIV-1 assays. Using the samples (n = 40) detected with both techniques, Viral loads obtained with Abbott Real-Time HIV-1 (Y-axis) assays were plotted against values of Generic HIV viral load (X-axis). The solid line represents the fitted regression and the Pearson correlation coefficient r 2 = 0.89 (P < 0.001) confirms the good correlation between both techniques
