Fig. 5.
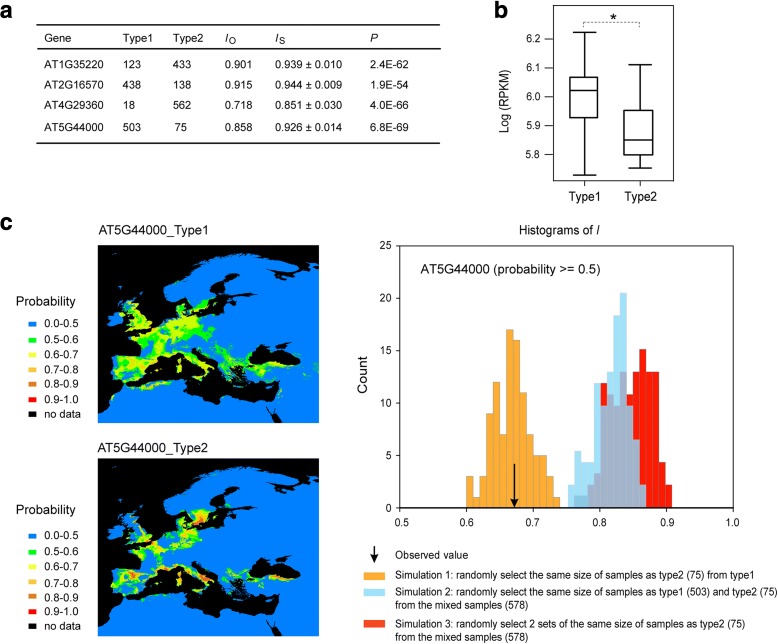
Ecological and expression divergence. a Significant ecological divergence between the two types of samples for each of the four genes, as indicated by the observed I score (I O) and simulated I scores (I S). b Expression divergence of the gene AT5G44000. c Left: Modeling of the niche with a high probability (≥ 0.5) of the two types of samples for AT5G44000. Right: Significance results under different permutation strategies (for niches with probability ≥ 0.5; I O = 0.673, 100 permutations)

