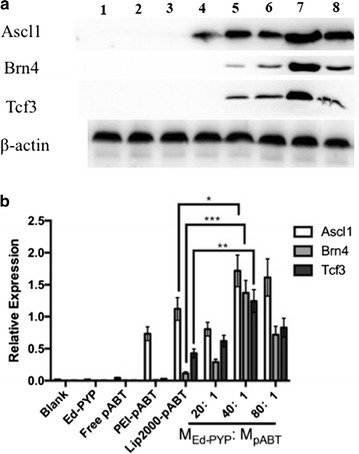
Fig. 2.

Protein-expression measurement. a Western blotting indicated the expression of the Ascl1, Brn4, and Tcf3 protein, using β-actin protein as the control. Lane 1, untreated 3T6 cells; lane 2, Ed-PYP treated 3T6 cells; lane 3, free plasmid group Ascl1, Brn4, Tcf3; lane 4, PEI-pABT; lane 5, Lipofectamine 2000 (Lip2000)-pABT; lane 6–8, 3T6 cells transfected with Ed-PYP–pABT nanoparticles prepared at 20:1, 40:1 and 80:1, respectively. b A quantitative analysis of the relative expression levels of Ascl1, Brn4, and Tcf3 (mean ± standard deviation of measurements from three replicates). *P < 0.05; **P < 0.01; ***P < 0.001; Student’s t-test
