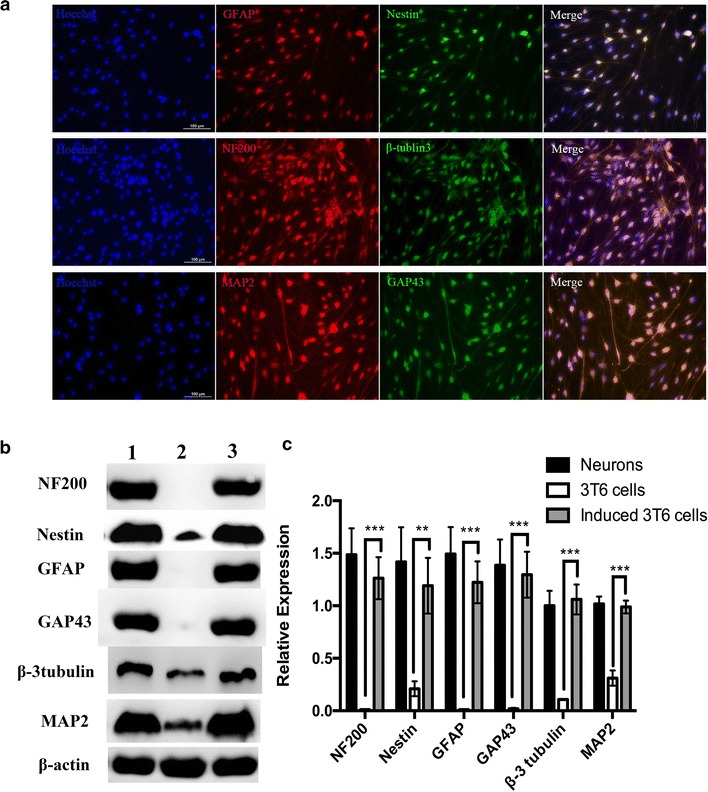
Fig. 7.

Neural conversion a immunofluorescence analysis of neural markers; b western blotting indicated the expression of neural markers; c a quantitative analysis of the relative expression levels of neural markers (mean ± standard deviation of measurements from three replicates). *P < 0.05; **P < 0.01; ***P < 0.001; Student’s t-test
