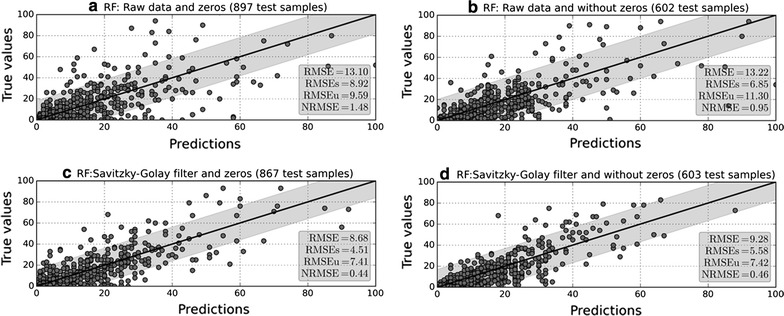
Fig. 2.

Performance of RF in each of the four selected scenarios. The X-axis represents the predictions yielded by the model and the Y-axis the true values measured by volunteers. To assess the quality of the volunteered AQT dataset, we have tested RF with varying levels of zero AQT and peaky AQT. As seen, the model has more difficulties in capturing peaks than zeros. Thus, the selected model for the following experiments is the model at the bottom left, because it presents the lowest metrics
