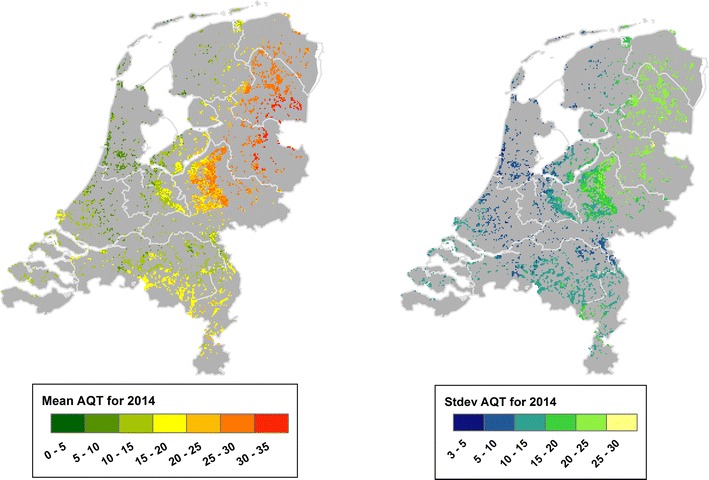
Fig. 5.

Predicted mean (left map) and standard deviation (right map) of AQT for 2014. The map of mean AQT ranges between 0 (green) and 32 (red) and shows how the highest values of tick activity during 2014 are concentrated within the provinces of Overijssel and Drenthe. The map of the standard deviation of AQT ranges between 3 (dark blue) and 26 (yellow) and shows the deviation from the mean of all forested pixels in the country. As seen, the east half of the country presents higher variations, indicating that tick activity in this areas may change significantly. On the contrary, the predictions along the coastal provinces (i.e. Noord-Holland, Zuid-Holland and Zeeland) do not seem to deviate significantly from the predicted mean
