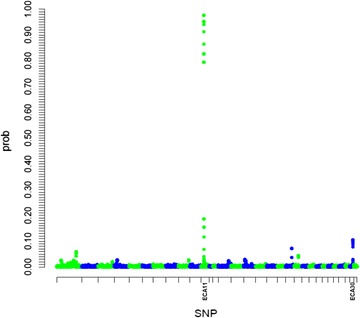
Fig. 2.

Plot of posterior inclusion probabilities showing a strong signal on ECA11. A genome-wide association study based on 46,215 SNPs was performed using a Bayesian sparse linear mixed model (BSLMM). Cumulative inclusion probabilities were computed for sliding windows of 15 SNPs and were plotted along the genome, taking the central SNP as reference. These data represent the probability for a region to have an effect above the polygenic background. A single strong signal encompassing the type I keratin gene cluster was observed on ECA11, with seven windows showing inclusion probabilities above 75% and an additional weak signal on ECA30 was also detected (four windows with inclusion probabilities under 20%)
