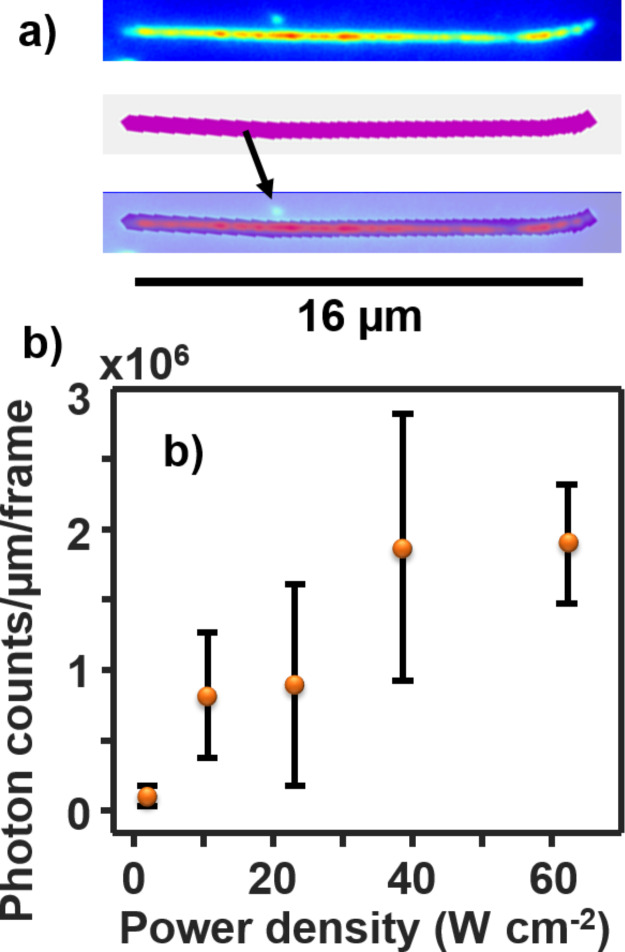
Figure 4.
(a) A single DNA molecule (top), the mask used (middle), and overlay (bottom) to select the DNA and filter the other events (the arrow). (b) The intensity (total photocounts) per micrometer of single DNA molecules as a function of laser power density. The images are obtained under TIRF mode but the power densities are measured under epifluorescence mode. YOYO-1 molecules are premixed with λ-DNA at a dye/base pair ratio of 1:10. The error bars represent the standard deviation between at least 25 DNA for two samples.

