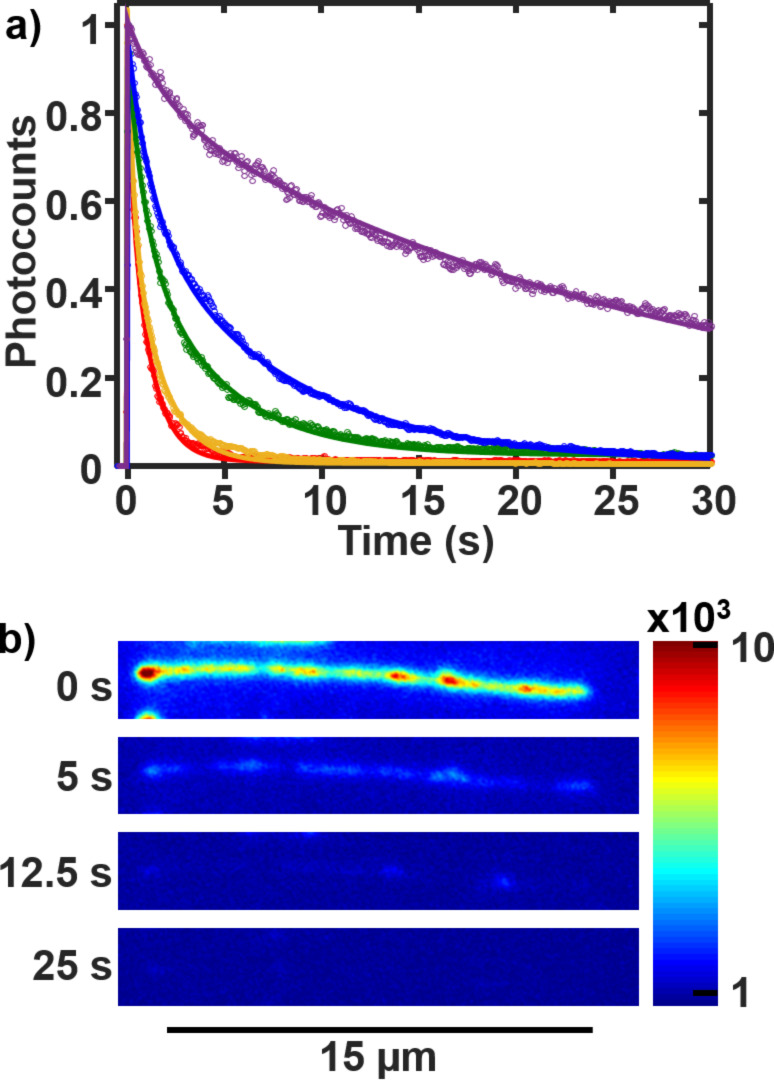
Figure 5.
(a) The time trace of the photocounts per micrometer of a single DNA strand for power densities of 62 W cm−2 (red), 38 W cm−2 (orange), 23 W cm−2 (green), 10 W cm−2 (blue), and 1.9 W cm−2 (violet). (b) Image of a DNA molecule at different times of the video. All images have the same color scale. A laser power density of 38 W cm−2 was used.

