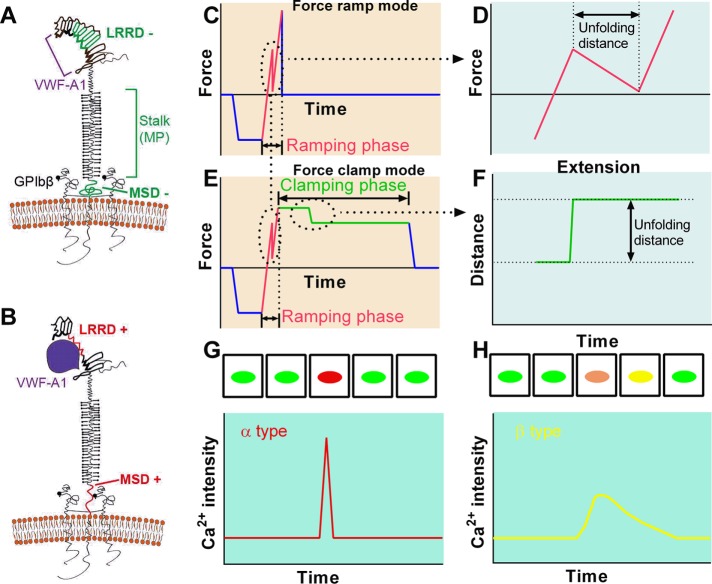
FIGURE 4:
Identification and characterization of GPIb mechanosensing mechanism. (A, B) Schematics of GPIb on the platelet membrane, highlighting the folded (−) and unfolded (+) LRRD and MSD. Ligand binding domain for VWF-A1 and other regions are indicated. (C–F) Illustrative BFP force traces showing zoom-in views of unfolding signatures in both ramping and clamping phases. (G, H) Illustrative analysis of GPIb-mediated single-platelet Ca2+ flux. Top, pseudo-colored images of intracellular Ca2+ in platelets in time sequences. Bottom, time courses of normalized intracellular Ca2+ intensity of the α (G) and β (H) types.

