FIGURE 1:
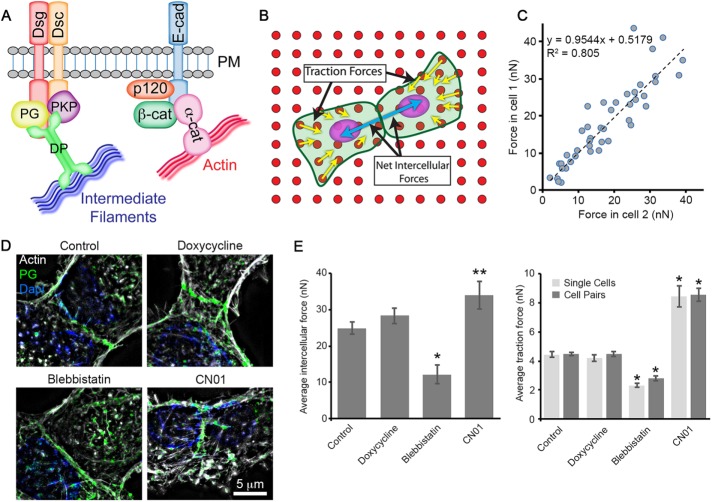
Quantification of cell–substrate and cell–cell adhesion using MA. (A) Schematic representation of the major protein constituents of DSMs (left) and AJs (right): PM, plasma membrane; DP, desmoplakin; Dsg, desmoglein; Dsc, desmocollin; PKP, plakophilin; PG, plakoglobin; E-cad, E-cadherin; p120, p120 catenin; β-cat, β-catenin; and α-cat, α-catenin. (B) Schematic representation of forces measured with MA. Cells (green) displace pillar tips (red) through traction forces (yellow arrows). Within cell pairs, the sum of the traction forces can be used to quantify net intercellular forces (blue arrows), which are equal and opposite in magnitude. (C) Force balance between cell pairs. The dashed line represents a linear regression, and the corresponding equation is shown. The theoretical condition in which the force in cell 1 equals the force in cell 2 would have a slope m = 1. (D) Superresolution micrographs of cells treated with the indicated compounds are shown with actin in white, plakoglobin (PG) in green to indicate the cell–cell junction, and DAPI in blue to show nuclei. (E) The average intercellular force and the average traction force per pillar are shown for cells treated with the indicated compounds. Error bars represent the standard error of the mean for 7–28 cells from three independent experiments. *, p < 0.001; **, p = 0.02.

