FIGURE 3:
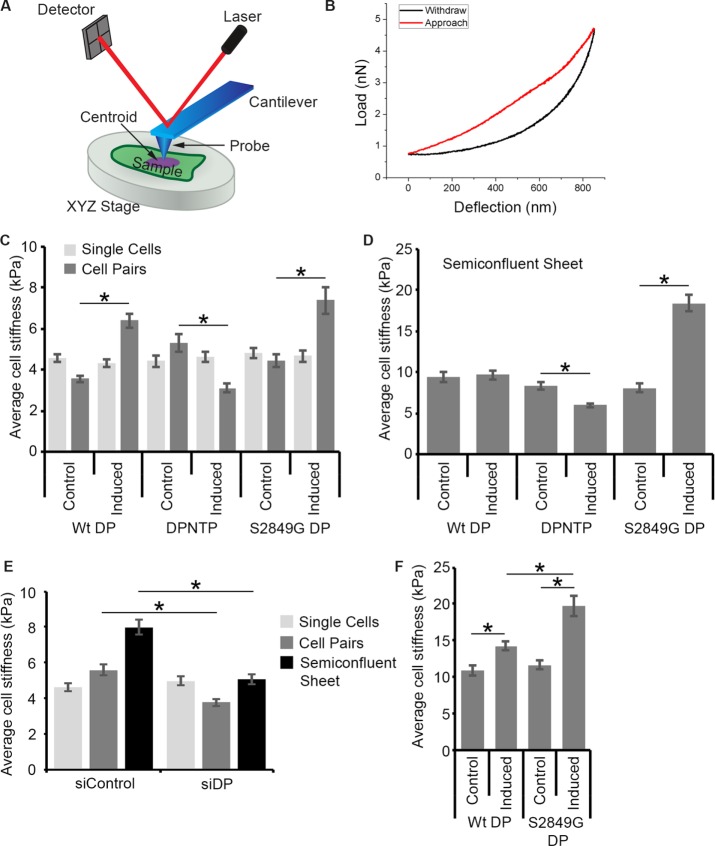
The DSM–IF network regulates cell stiffness. (A) Schematic diagram of an atomic force microscope. A cantilever is used to probe the physical properties of a cell. The displacement of the cantilever is determined by the movement of a laser across a detector. (B) A load vs. deflection function for both the approach and withdrawal of the AFM tip is shown. (C) Average cell stiffness measurements on single cells and cell pairs for cells expressing the indicated DP variants are shown (control and induced conditions). All force-displacement curves were taken by AFM on the cell centroid and were converted to stiffness using the Hertz model. Error bars represent the standard error of the mean from at least 45 cells from three independent experiments. *, p < 0.0001. (D) Average cell stiffness measurements of individual cells within semiconfluent (80%) cell sheets for cells expressing the indicated DP variants are shown (control and induced conditions). Error bars represent the standard error of the mean from at least 91 cells from three independent experiments. *, p < 0.0001. (E) Average cell stiffness measurements on single cells, cell pairs, and cell sheets for DP knockdown (siDP) and nontargeting siRNA control (siCtl) conditions are shown. Error bars represent the standard error of the mean from at least 55 cells from three independent experiments. *, p < 0.0001. (F) Average cell stiffness measurements of calcium-insensitive, confluent cell sheets for cells expressing the indicated DP variants are shown. Error bars represent the standard error of the mean from at least 58 cells from three independent experiments. *, p ≤ 0.0002.

