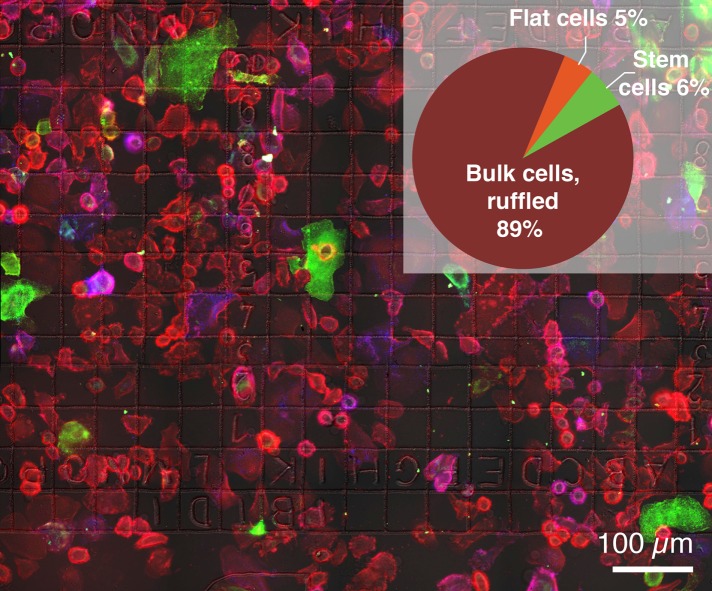
FIGURE 1:
Fluorescence microscopy image of adherent SKBR3 breast cancer cells. QD labels coupled to HER2 membrane proteins appear in red. Membrane-bound CD44 protein is shown in green and CD24 in blue. (Inset) Distribution into three different phenotypic subpopulations, ruffled bulk, flat, and CSCs as determined from a total of 3367 cells.

