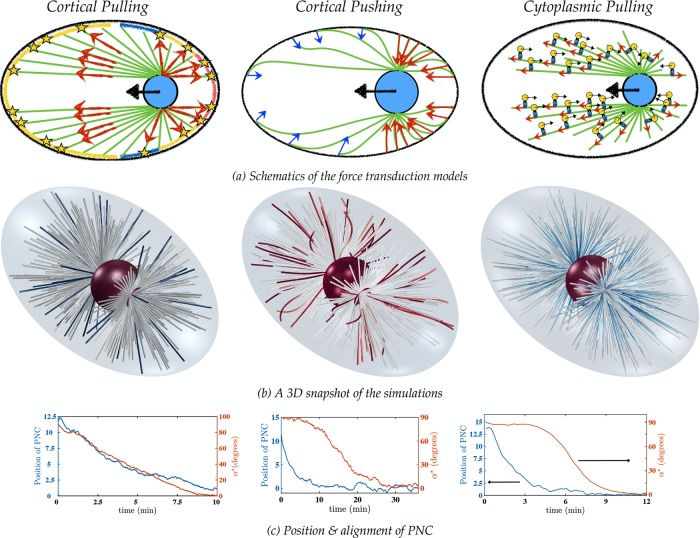
FIGURE 5:
(a) The force transduction mechanisms. Left, cortical pulling model, in which the blue, yellow and red strips on the cortex correspond to the lowest, average, and highest density, respectively, of the cortical force generators. See the Supplemental Materials for details. Middle, the cortical pushing model. The larger number of MTs polymerizing against the cortex on the posterior side and their shorter lengths (corresponding to larger bending forces) result in larger pushing forces on the posterior pole (compared with the anterior) and pronuclear migration from posterior to the center of the cell. Right, the length-dependent cytoplasmic pulling mechanism, in which cargo-carrying dynein motors apply pulling forces on the astral MTs. Longer MTs have more dyneins attached to them, which result in pronuclear migration toward the longest MT, that is, from posterior to the center of the cell. (b) Long-time 3D snapshots of the simulations in the three mechanisms (Supplemental Movies S1–S3). The fibers are color coded with respect to the local tension; red, blue, and white denote compressional, extensional, and no forces, respectively. In the cortical and cytoplasmic pulling models, the MTs are under extensile forces and thus remain straight; in the cortical pushing simulations, the MTs are buckled due to the compressional forces from their polymerization against the cortex. (c) Variations of the PNC position and angle between the intercentrosomal axis and the AP axis vs. time.

