FIGURE 7:
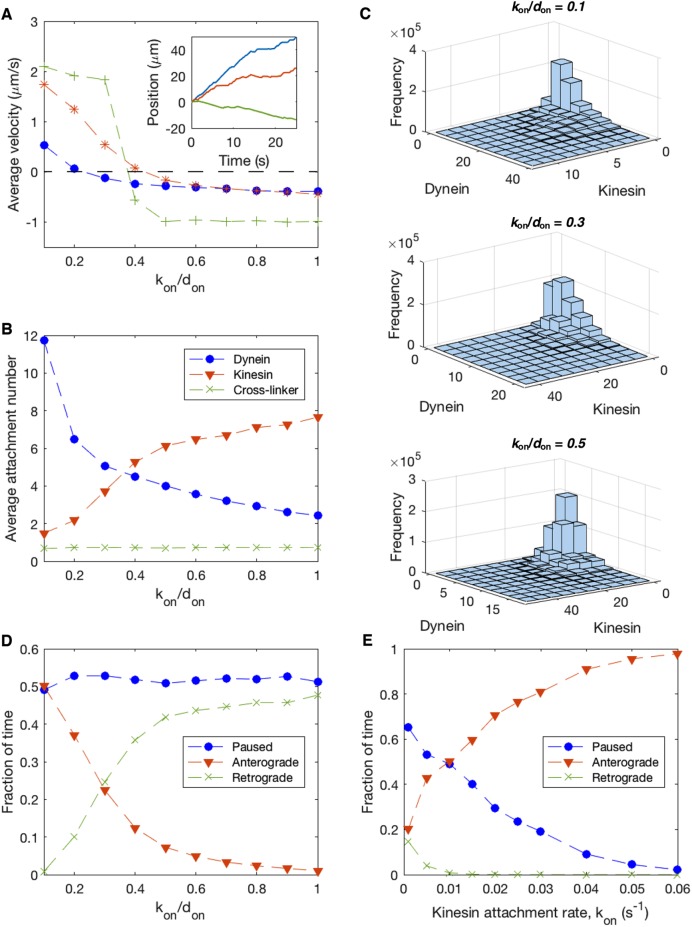
Inhibition of dynein allows kinesin to play more prominent role in MT transport. Parameters from Table 1, L = 2 μm, xon = 0.003 s−1, and kon = 0.01 s−1 except where indicated otherwise. (A) Time-averaged velocity as a function of the ratio of kinesin attachment rate to dynein attachment rate (kon/don) for several values of the kinesin attachment rate: kon = 0.1 s−2 (green “+” symbols), kon = 0.01 s−1 (red “*” symbols), and kon = 0.001 s−1 (blue circles). For each data set, the kon/don ratio is increased by reducing the dynein attachment rate, don, while keeping kon constant, mimicking experimental inhibition of cytoplasmic dynein activity. Inset: Sample trajectories corresponding to kon = 0.01 s−1 are shown for kon/don = 0.1 (blue), kon/don = 0.3 (red), and kon/don = 0.5 (green). (B) Average attachment numbers of cytoplasmic dynein, kinesin-1, and static cross-linkers as a function of kon/don. (C) Histogram of instantaneous attachment numbers of dynein and kinesin. (D) Fraction of time MT spends paused, moving in the anterograde direction, and moving in the retrograde direction as a function of kon/don, with a fixed kinesin attachment rate, kon = 0.01 s−1. (E) Fraction of time MT spends paused, moving in the anterograde direction, and moving in the retrograde direction as a function of kon, with a fixed ratio kon/don = 0.1.

