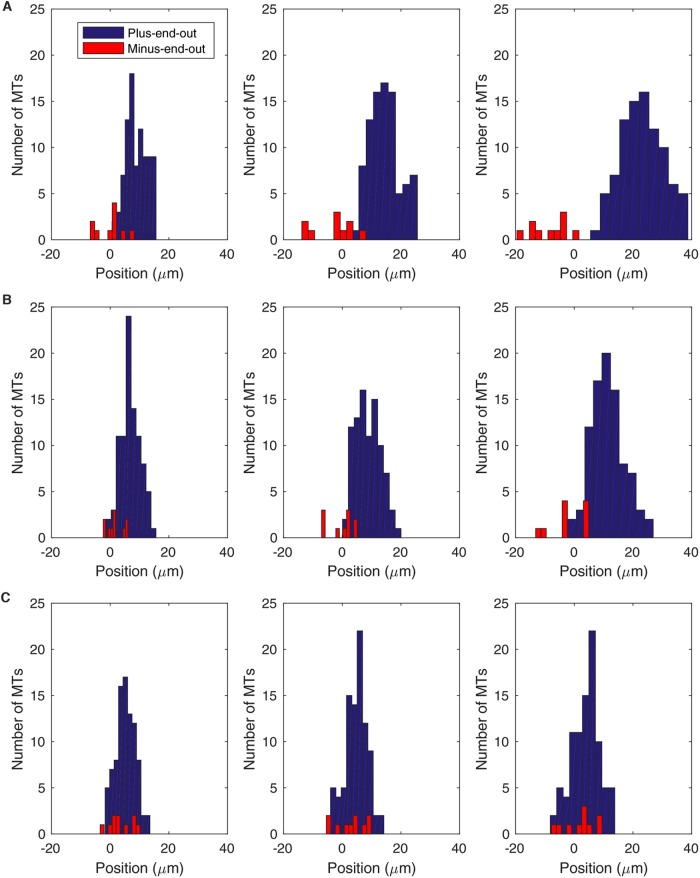
FIGURE 8:
Dynein inhibition disrupts the establishment of plus-end-out MT polarity pattern. Parameters from Table 1, L = 2 μm, xon = 0.003 s−1, kon = 0.01 s−1. Distributions of plus-end-out MTs (blue) and minus-end-out MTs (red) for several values of kon/don evolve over time. Each simulation has an initial distribution of 90 plus-end-out MTs and 10 minus-end-out MTs evenly distributed between x = 0 and x = 10 μm at time t = 0. (A) MT distribution for high dynein activity level (kon/don = 0.1) at times t = 2 s (left), t = 5 s (middle), and t = 10 s (right). (B) MT distribution for kon/don = 0.3 at times t = 2 s (left), t = 5 s (middle), and t = 10 s (right). (C) MT distribution for kon/don = 0.5 at times t = 2 s (left), t = 5 s (middle), and t = 10 s (right).

