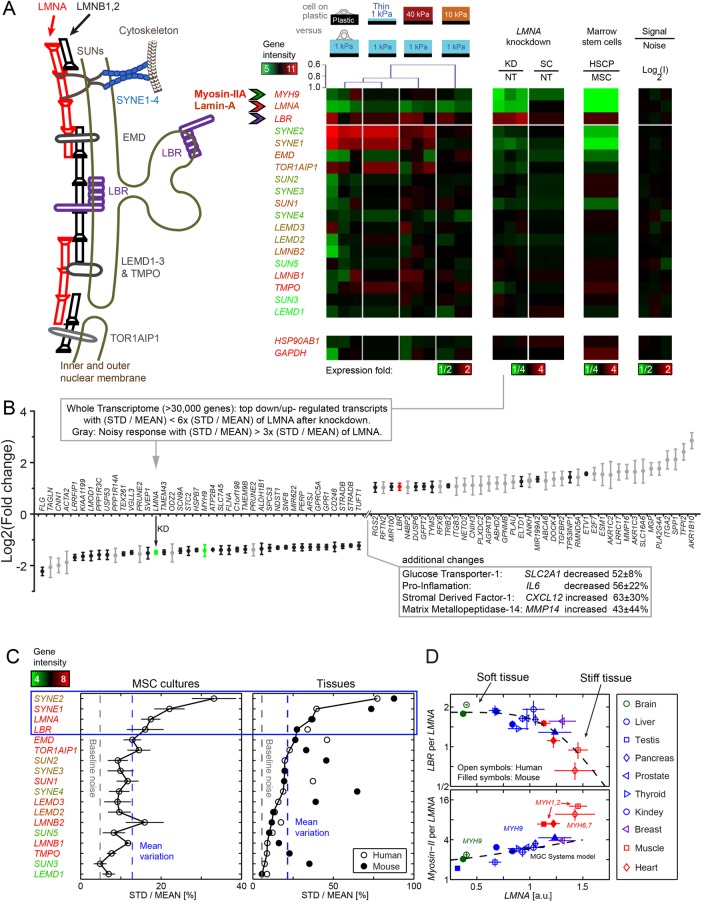
FIGURE 4:
Transcript profiles reveal mechano-responsive nucleo-structural genes. (A) Nuclear envelope schematic and variations in transcript levels. Consistent with matrix-directed morphologies of nuclei, heatmaps of MSCs cultured (for 36 h) on soft-and-thin gels correlate best with cultures on rigid plastic: Dendrogram shows a Pearson correlation p = 0.9. Absolute gene expression intensities averaged across matrix conditions are color-coded by gene symbols (e.g., MYH9 is high, LMNA is intermediate, SYNE2 is very low). Second heatmap: Knockdown of lamin-A produces a low contractility MSC phenotype with down-regulation of MYH9 relative to nontreated (NT) or scrambled siRNA (SC). Third heatmap: Hematopoietic stem cells and progenitors (HSCPs) likewise exhibit a low contractility phenotype with low MYH9 levels correlating with LMNA. In all heatmaps, LBR is anti-correlated. Fourth heatmap: Technical noise across triplicate hybridizations on three microarrays is <4% on average and no greater than 7% STD of mean intensity. Bottommost “housekeeping” genes validate intensity (n = 3 unless indicated). (B) Whole-genome transcriptome changes as indicated after LMNA knockdown. (C) Four mechano-malleable nuclear envelope genes (LMNA, SYNE1, SYNE2, and LBR) exhibit maximal transcriptional variation (STD normalized by mean) across matrix elasticity and thickness conditions in MSC cultures (left) and also in mouse and human tissues (right) of various stiffnesses (brain, liver, kidney, skeletal muscle, heart). For the latter, the species with the least variation provides the highest confidence for comparison. As indicated by the text color of the gene names, the top four nuclear envelope components are expressed at moderate to high levels, whereas similar genes such as the B-type lamins show little variation. (D) Consistent with the anti-correlation in MSC cultures, LBR transcript levels decrease with LMNA for the stiffest mouse and human tissues. Consistent with the noted correlation in MSC cultures, the most abundant myosin-II (e.g., MYH9) is positively correlated with LMNA. LBR/LMNA fits a Hill function for inhibition with exponent n = 5.5. Myosin-II isoform switching and muscle specialization are evident in skeletal (MYH1,2) and cardiac (MYH6,7) muscle, which are more than twofold above the trend for nonmuscle MYH9 that fits a Mechanobiological Gene Circuit Systems model (Buxboim et al., 2014). Consistent with tissue stiffness trends, brain (ectodermal tissue: green) is softer than liver (endodermal: blue), which is softer than muscle (mesoderm: red), and LMNA levels increase (n = 3 per tissue).

