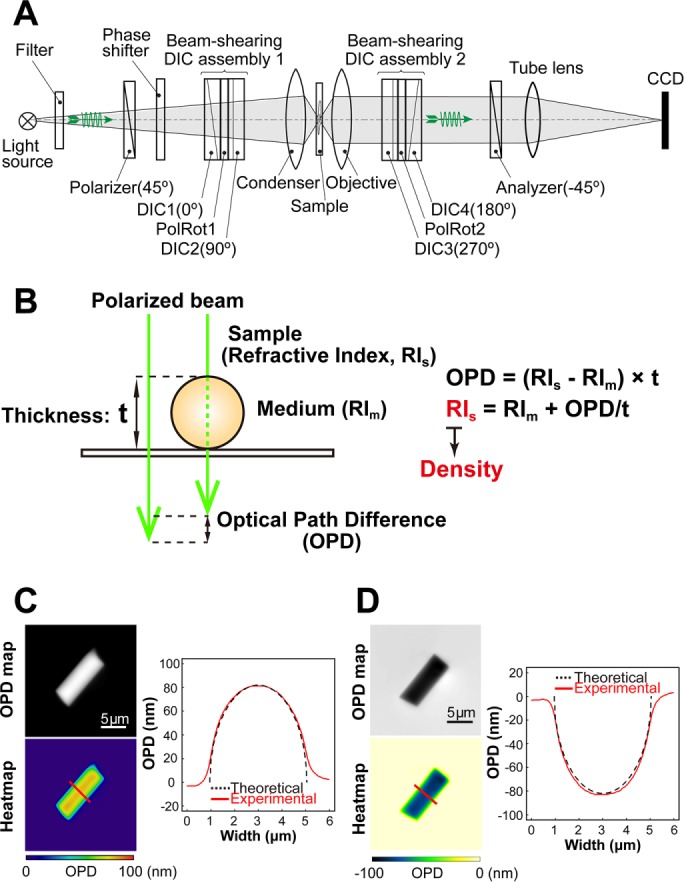
FIGURE 1:

OI-DIC imaging system for biological samples. (A) Schematic of the OI-DIC setup. Details of the microcopy system are described under Materials and Methods. (B) A procedure for estimating sample (depicted as a sphere) RI. Our OI-DIC microscopy can computationally quantify optical path differences (OPDs) at each spatial point. For details, see Materials and Methods. (C, D) Validation of density imaging by OI-DIC microscopy using known glass rods and mineral oils. The RI of the glass rods was 1.56, and those of the oils were 1.54 in C and 1.58 in D. Note that the theoretical and experimental values were almost the same, ensuring the accuracy of our RI quantification. Scale bar: 5 µm.
