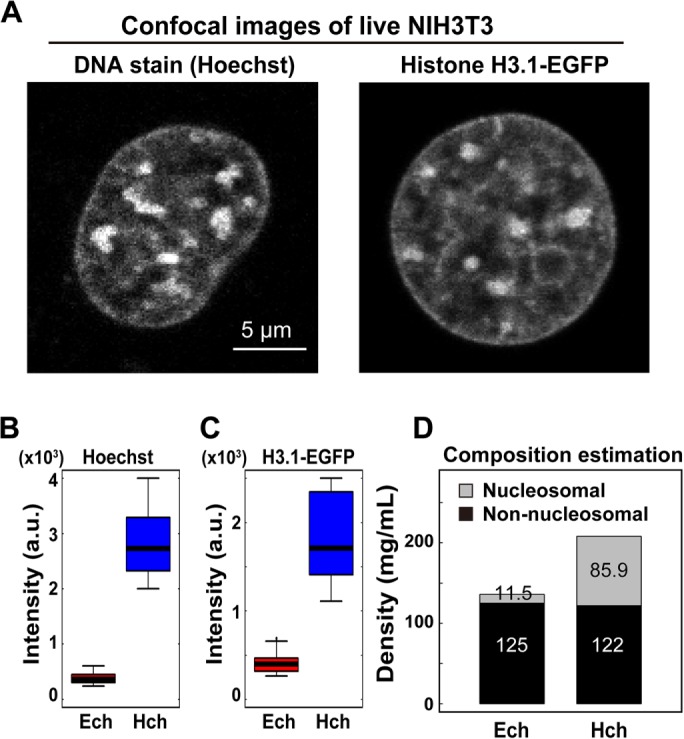
FIGURE 3:

Difference in DNA density between pericentric heterochromatin foci and euchromatin. (A) Typical confocal images of Hoechst 33342 and H3.1-EGFP signals in live NIH3T3 cells. Large foci in the nuclei are pericentric heterochromatin foci. Scale bar: 5 µm. (B, C) Differences in signal intensity between the heterochromatin (Hch) and surrounding euchromatin (Ech) regions in live NIH3T3 cells. Signal intensity ratios: 7.5 (Hoechst 33342, B) and 5.5 (H3.1-EGFP, C). n = 18 for Hoechst 33342 staining and n = 16 for H3.1-EGFP. (D) Estimated composition of the pericentric foci and euchromatin in live cells. Note that nonnucleosomal materials (nonhistone proteins, RNAs) were dominant in both chromatin regions. For details, see Materials and Methods.
