FIGURE 4:

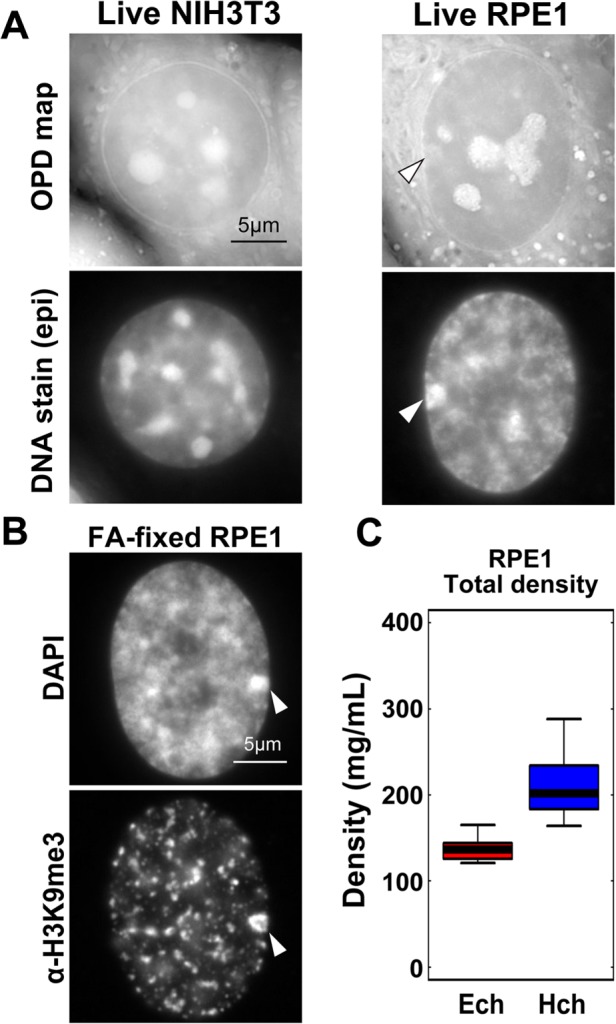
Density of condensed inactive human X chromosome. (A) OPD maps (first row) and DNA staining (second row) of live NIH3T3 cells (left) and RPE1 cells (right). Note that the RPE1 cell has a brightly stained area attached to the nuclear envelope (arrowhead), which is likely to be an inactive X chromosome. High-intensity regions in the nuclei of OPD maps are nucleoli (also see Supplemental Figure S4). (B) Fluorescence images of DNA staining (DAPI, upper) and α-H3K9me3-immunostaining of FA-fixed RPE1 cells. Regions surrounding inactive X chromosomes seem to be free of H3K9me3 marks. (C) The density of the nucleoplasm (euchromatin, Ech) and inactive X chromosome (heterochromatin, Hch) in RPE1 cells (density ratio: 1.48, n = 10 for each).
