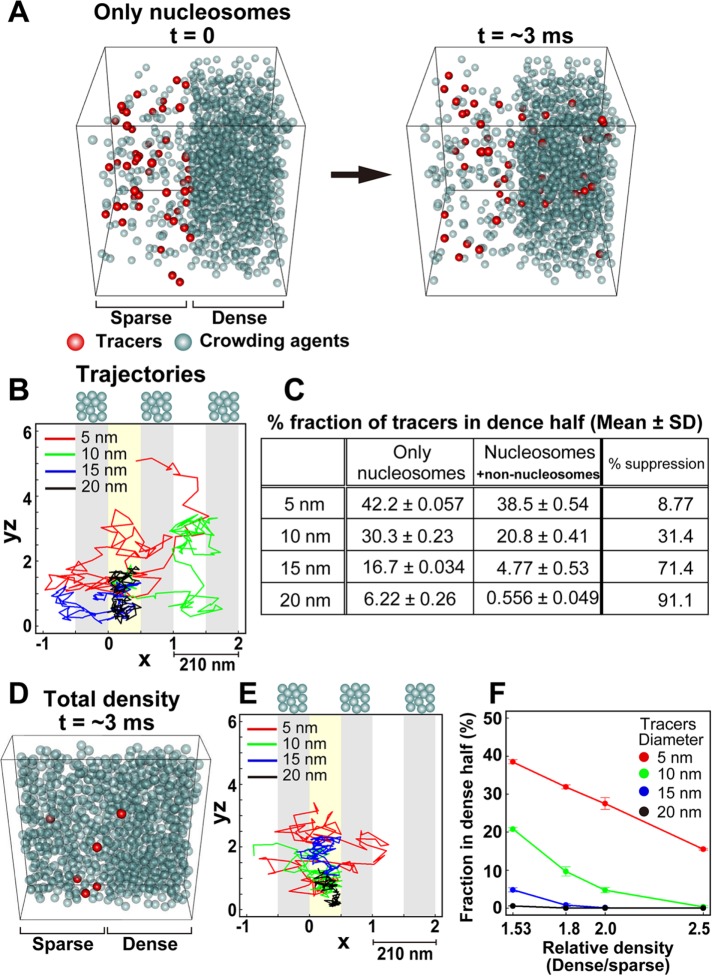
FIGURE 5:
Moderate access barrier for heterochromatin revealed by Monte Carlo simulation. (A) Simulation schemes to study the molecular access to heterochromatin in the “nucleosomes only” situation. Different numbers of crowding agents (gray spheres) were put into the left and right halves of the box at densities corresponding to the nucleosome densities of euchromatin (11.5 mg/ml) and heterochromatin (85.9 mg/ml). Then 50 tracers (red spheres) were placed in the left half of the box (left, time t = 0), and all tracer spheres were randomly moved. Later, some of the tracers (red spheres) moved into the heterochromatin region (right, time t = ∼3 ms). We analyzed the fraction of tracers in the dense half and the trajectories of the tracers. To aid in visualization, crowding agents were made transparent. (B) Typical trajectories of the tracers in the simulation corresponding to A with periodic boundaries to avoid problems caused by finite space. The trajectories were two dimensionally projected onto an x-yz plane. yz is a cylindrical coordinate; yz = (y2 + z2)1/2. The dense regions are shaded in gray, and the starting regions for the tracers are marked with yellow. Tracers with diameters of 5 or 10 nm could easily diffuse into the dense regions. (C) Table showing the percentages of various tracers (5, 10, 15, and 20 nm) that were localized in the dense half. From left to right columns: only nucleosomes condition (mean ± SD); nucleosomes/nonnucleosomes condition (mean ± SD); percentage suppression to dense regions in the nucleosomes/nonnucleosomes condition. (D) Snapshot of the simulation with additional crowding agents (nonnucleosomal materials): sparse euchromatin (left, 136 mg/ml) and dense heterochromatin (right, 208 mg/ml) regions at t = ∼3 ms. To aid in visualization, only part of the simulation space is presented (20% of the entire space, 210 × 210 × 42 nm). (E) Typical trajectories of the tracers in the simulation corresponding to D with periodic boundaries. Note that the diffusions of tracers were suppressed to a greater degree than in B. (F) Fraction of tracers localized in the dense region under various density conditions. For each tracer type (5-, 10-, 15-, and 20-nm diameter), the fraction within the dense half at equilibrium (∼50 ms) is shown. Note that the 1.53-fold higher density corresponds to the estimated density ratio between heterochromatin and euchromatin in live cells.

