FIGURE 1:
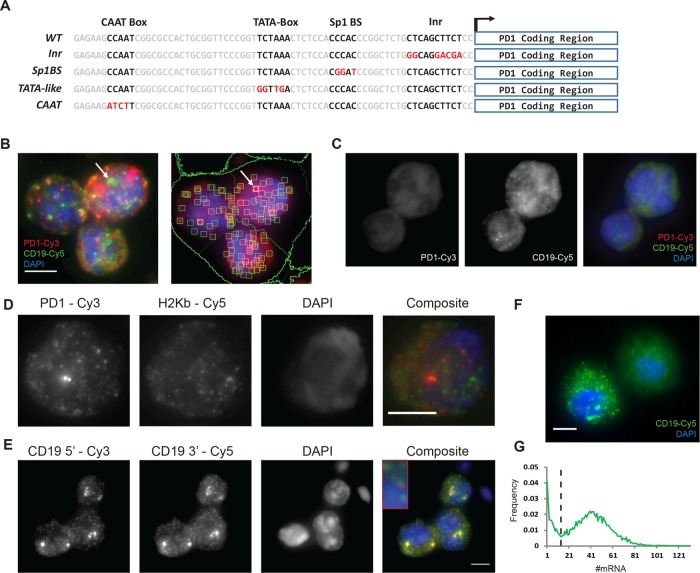
Single mRNA transcripts detected by FISH in primary B-lymphocytes. (A) Sequence of the PD1 proximal promoter. Promoter elements are boxed and the mutations in each element indicated in red. (B) Detection and counting of single PD1-Cy3-labeled and CD19-Cy5-labeled mRNA transcripts in primary B-cells stimulated ex vivo. Left panel: Maximum-intensity projection of smFISH staining of B-cells; red and green spots indicate single PD1 and CD19 mRNAs, respectively. White arrow indicates CD19 transcription site with multiple nascent mRNAs. Right panel: Green squares identify individual mRNA molecules and circles identify transcription sites. (C) PD1/CD19 smFISH in a transgene-nonexpressing mouse. (D) smFISH with anti PD1-Cy3 and H2Kb-Cy5 probes in primary B-cells show nonoverlapping detection of endogenous and transgenic MHC class I mRNA. (E) Colocalization of smFISH spots for CD19 with two probe sets targeted to the 5′ and 3′ regions of the mRNA. (F) CD19 smFISH in B-cell stimulated culture. Image shows a CD19-expressing lymphocyte and a CD19-negative lymphocyte. (G) Bimodal distribution of CD19 transcripts indicates non–B-cells remaining in the population after stimulation. Black line indicates threshold for CD19 positive B-cells gated for downstream analysis. Scale bars represent 5 µm.

