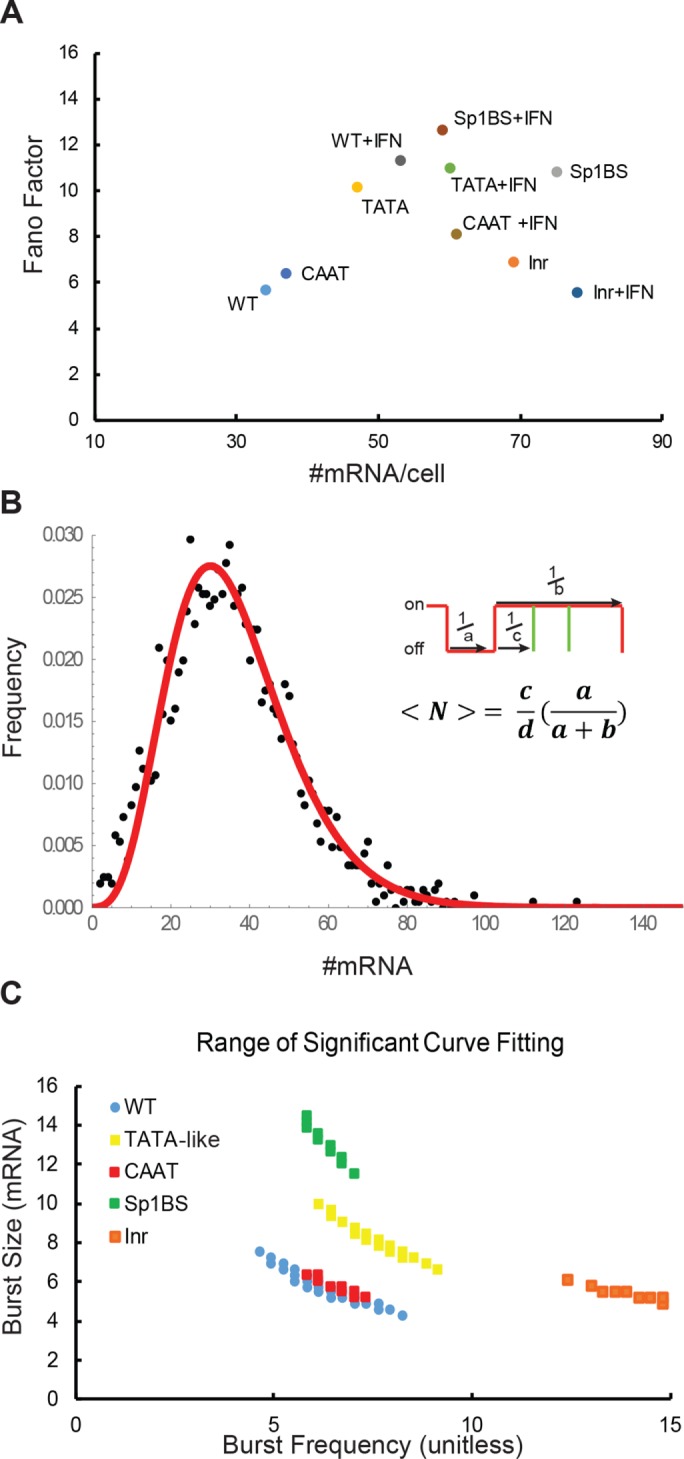
FIGURE 3:

Bursting dynamics of PD1 core promoter mutants. (A) Fano factor vs. mean mRNA/cell of PD1 core promoter element mutants in B-lymphocytes stimulated in the absence or presence of γ-interferon. (B) A best fit curve generated from the two-state bursting telegraph model to a PD1 mRNA distribution. The two-state model can be represented as combined rates of a, a gene turning on; b, a gene turning off; and c, the rate of transcript firing with a burst. (C) Burst parameters that that satisfy the χ2 null hypothesis test (p > 0.1) for the WT distribution and for the core promoter mutants. Nonoverlapping distributions indicate samples with significantly different bursting kinetics. Burst size is mRNA/cell; burst frequency is unitless.
