
FIGURE 5:
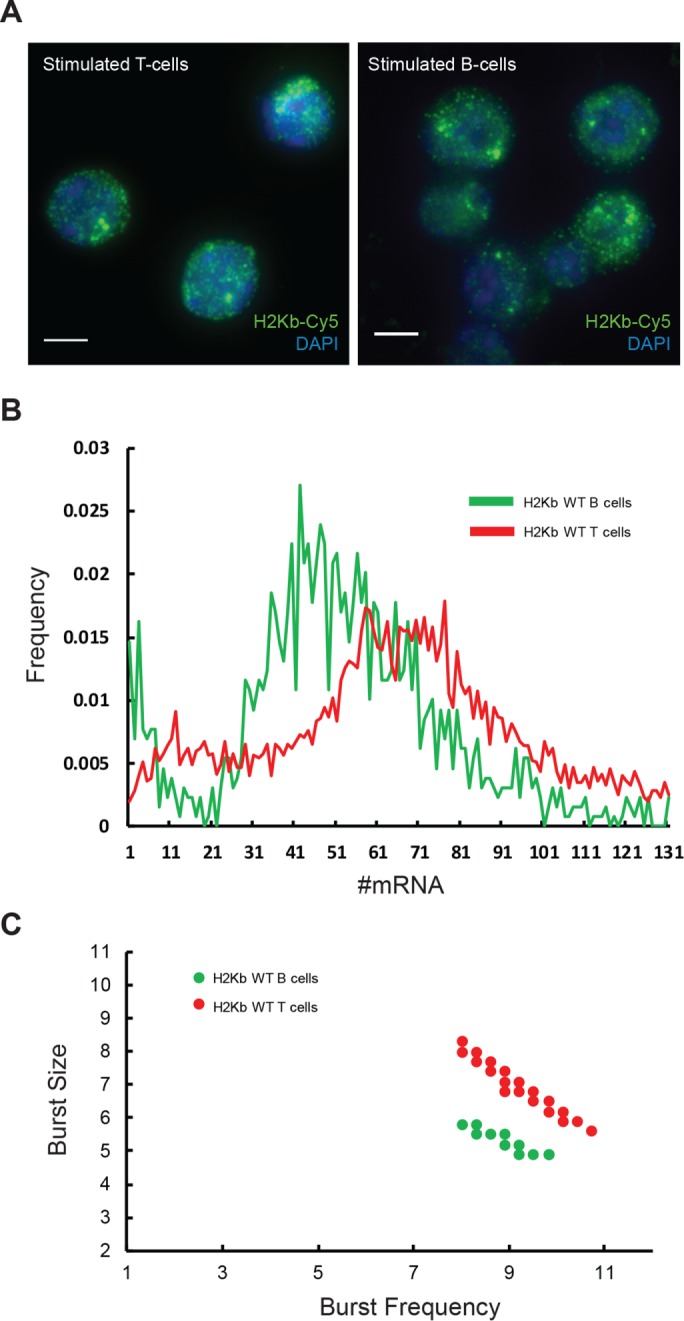
Tissue-specific expression dynamics of H2Kb. (A) smFISH of H2Kb RNA in primary T- (left) and B-lymphocytes (right). (B) Pooled and normalized H2Kb mRNA distributions in primary T- and B-lymphocytes. (C) The differential bursting dynamics of the two distributions.