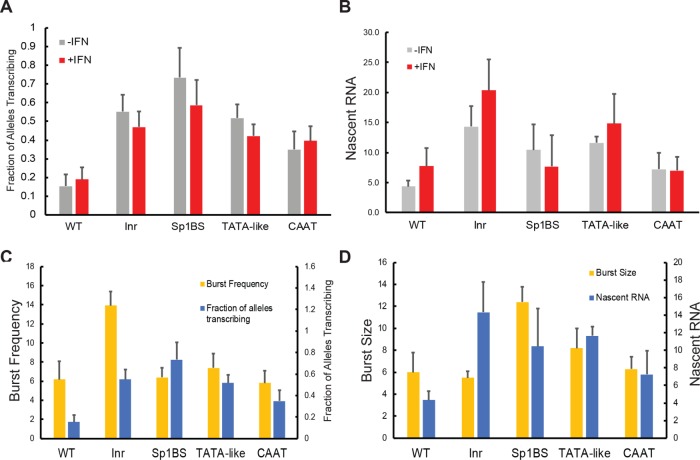
FIGURE 6:
Frequency and relative intensity of active transcription sites in PD1 core promoter mutants. (A) Frequency of active PD1 transcription sites over all alleles present in B-lymphocytes from WT and core promoter mutants in the presence and absence of interferon (IFN). Error bars represent the Poisson standard error. (B) Average number of nascent transcripts per PD1 transcription site in the presence and absence of interferon. Number of transcripts per given transcription site calculated by normalizing intensity to the mean intensity of a single mRNA in that field. (C) Comparison of the fraction of the inferred burst frequency with the measured fraction of alleles transcribing, in the absence of interferon. Error bars of the burst frequency represent the χ2 range of solutions. (D) Comparison of the inferred burst size with measured nascent RNA in the absence of interferon. Error bars of the burst size represent the χ2 range of solutions.

