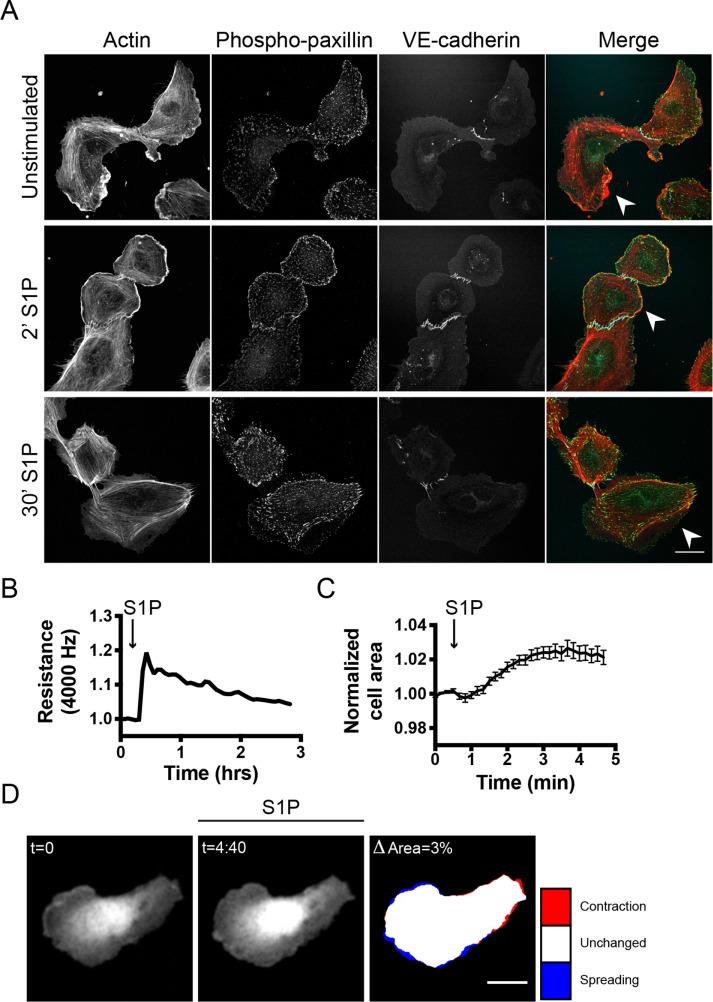
FIGURE 1:
S1P promotes endothelial barrier function: analysis toward a single cell level. (A) ECs were grown to a semiconfluent monolayer, stimulated with S1P (500 nM), and stained for F-actin, phospho-paxillin, and VE-cadherin. Arrowheads highlight protruding areas. Scale bar = 25 μm. (B) ECs were grown to a monolayer on ECIS electrodes and stimulated with S1P at t = 0.3 h. Endothelial resistance (4000 Hz) was measured using the ECIS, normalized to the value at t = 0, and plotted versus time. (C) ECs, transiently transfected with mTq2, were grown to a monolayer. Local changes in the area of a single cell were measured before and after stimulation with S1P at t = 0:30 min. Graph displays a representative dataset of n = 9. (D) Corresponding image of the plot in C. Colors in the right image represent area change after S1P stimulation (look-up table panel on the right). Scale bar = 25 μm.

