FIGURE 5:
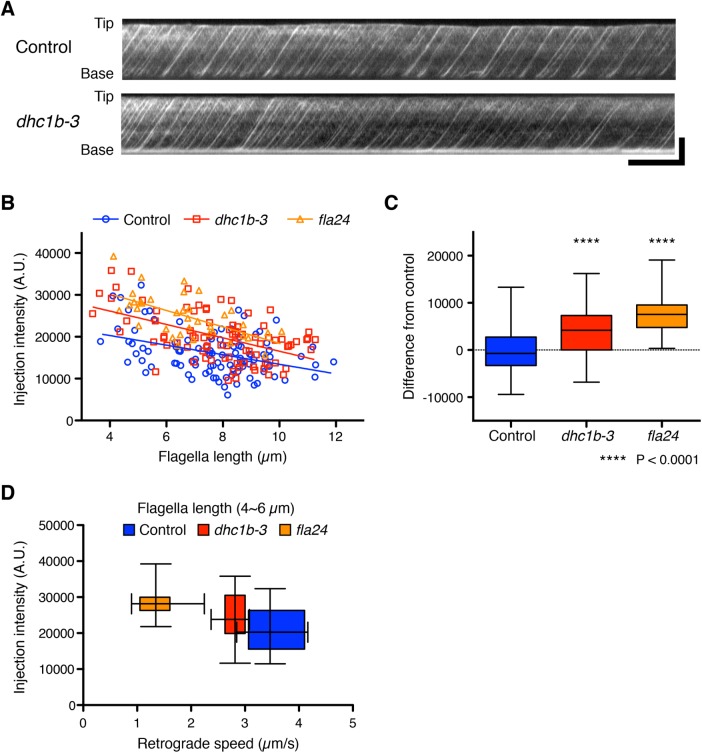
IFT injection intensities were increased in dynein mutant cells. (A) Representative kymographs of Chlamydomonas flagella in control (fla3 KAP-GFP) and dhc1b-3 (dhc1b-3 fla3 KAP-GFP) strains. These kymographs were assembled from Supplemental Videos S3 and S4. Horizontal bar: 5 s; vertical bar: 5 µm. (B) The mean injection intensity of each flagellum was calculated from kymographs and plotted against flagella length. Control (blue circles, n = 103 flagella), dhc1b-3 (red squares, n = 85 flagella), and fla24 (orange triangles, n = 37 flagella). (C) A box-and-whisker plot shows the mean difference of injection intensity from the control regression line. Both dynein mutant cells inject more IFT into flagella than control cells. Significance was determined by unpaired two-tailed t test (****P < 0.0001). (D) Relationship between injection rate and retrograde speed, derived by taking all flagella in the length range 4–6 µm for all three genotypes and plotting their average injection intensity (as in B) on the vertical axis and their average retrograde speed (as in Figure 3D) on the horizontal axis as a two-dimensional box-and-whisker plot. Control (blue, n = 18 flagella), dhc1b-3 (red, n = 13 flagella), and fla24 (orange, n = 12 flagella).

