FIGURE 6:

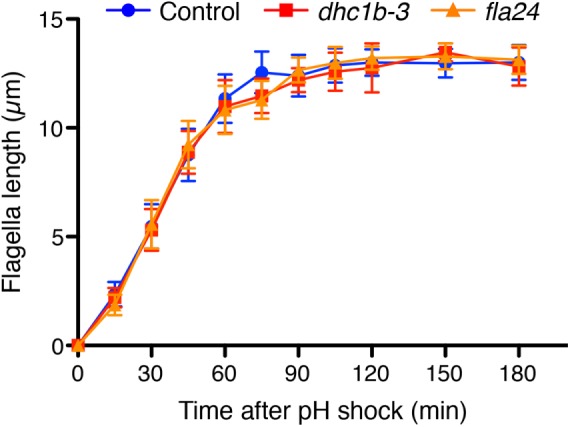
The kinetics of flagella regeneration of control (wild-type CC-125, blue circles) and dynein mutant (dhc1b-3 and fla24, red squares and orange triangles, respectively) cells. n = 20 cells per strain and time point.

The kinetics of flagella regeneration of control (wild-type CC-125, blue circles) and dynein mutant (dhc1b-3 and fla24, red squares and orange triangles, respectively) cells. n = 20 cells per strain and time point.