FIGURE 2.

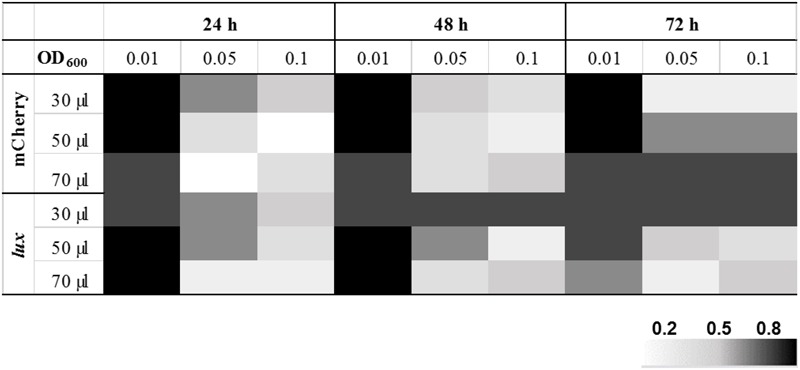
Optimization of HTS parameters. Heat map of Z-factor values from optimization of fluorescent mCherry and the bioluminescent Lux reporter screen with the M. abscessus 390S strain. The data is an average of three independent experiments.

Optimization of HTS parameters. Heat map of Z-factor values from optimization of fluorescent mCherry and the bioluminescent Lux reporter screen with the M. abscessus 390S strain. The data is an average of three independent experiments.