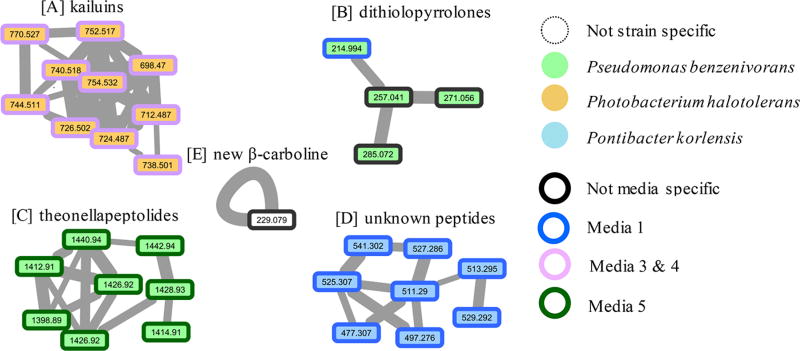
Figure 1.
Examples of molecular networks visualized after analysis of accurate MS2 data via the Global Natural Products Social Molecular Networking (GNPS; http://gnps.ucsd.edu) tools. The networks were obtained from analyses of crude extracts from near-shore-derived Gram-negative bacteria grown in five different media (see Table S1). Annotations depict variation in metabolite production based on strain and media conditions. Line thickness between nodes describes the similarity of the linked parent masses’ MS2 spectra. Panels illustrate trends as follows: (A) P. halotolerans yields kailuins in both media 3 and 4 (e.g., kailuin D, [M + H]+ m/z 752.517); (B) P. benzenivorans yields some dithiolopyrrolones, particularly in medium 1 (e.g., holomycin, [M + H]+ m/z 214.994); (C) P. benzenivorans yields theonellapeptolides in medium 5 (e.g., theonellapeptolide Ib, [M + Na]+ m/z 1440.94); (D) P. korlensis yields polypeptides in medium 1; and (E) six strains produce 1-methyl-4-methylthio-β-carboline (1) ([M + H]+ m/z 229.079) in all media including those shown here and Achromobacter spanius, Pseudoaltermonas elyakovii, and Cellulophaga baltica (see Figure S14).

